Gold Price Today Slides as Hormuz Tensions Fuel Fed Rate Hike Bets?


Gold just had one of its rarest single-day drops in two decades, falling 3.4% before today's small bounce.
This Gold price prediction looks at whether the $4,100 zone holds or whether gold slides toward $4,000.
Gold Latest News: Iran Deadlock Keeps Pressure on the Fed
A report said gold held a sharp decline as a deadlock between the U.S. and Iran over the Strait of Hormuz kept energy costs elevated, which in turn kept pressure on the Federal Reserve to raise interest rates.
The Strait of Hormuz is a shipping route many oil tankers pass through, so tension there can push oil and energy costs generally higher.
The report's headline said gold was trading near a seven-week low as rate-hike pressure mounted.
Higher interest rates tend to weigh on gold, since gold pays no interest itself and becomes less attractive next to yield-bearing assets.
CoinGabbar could not independently verify the report's details beyond what was shown.
Gold News: A Statistically Rare Single-Day Drop
A separate post said the drop in gold prices was highly unusual, falling 3.4% in a single day, one of the rarest declines of the past two decades.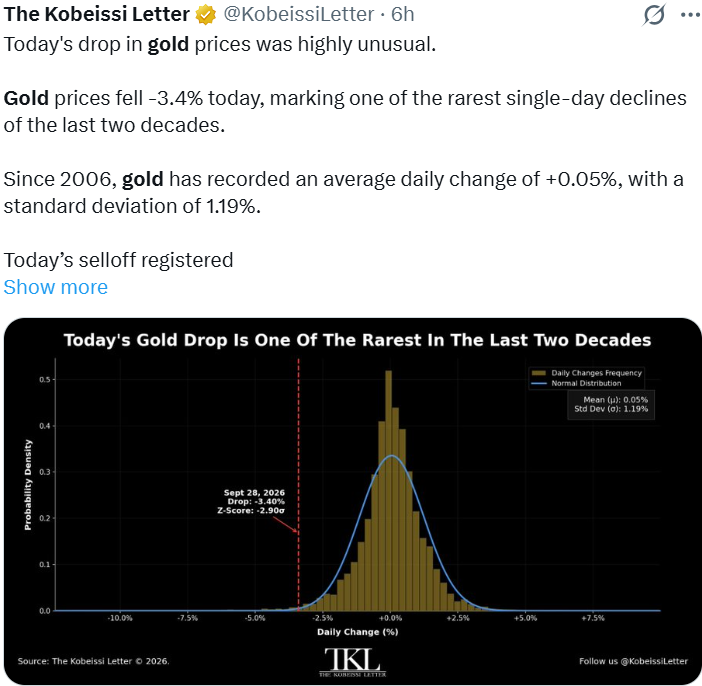
The post said gold has averaged a daily change of about +0.05% since 2006, with a standard deviation of 1.19%, and that today's move worked out to a Z-score of -2.90, deep in the left tail of that distribution.
A Z-score measures how far a move sits from the average, in standard deviations, so -2.90 means this drop was far larger than a typical day.
The post said a decline this extreme happens only about 0.2% of the time, or roughly once every two years, and pointed to a surge in bond yields as the disruption behind it.
CoinGabbar could not independently verify these statistics, as no underlying dataset was linked.
Gold Price Today: Technical Analysis
Gold spent late May through July in a steady decline before recovering through August and climbing to a high near $4,690 in early September.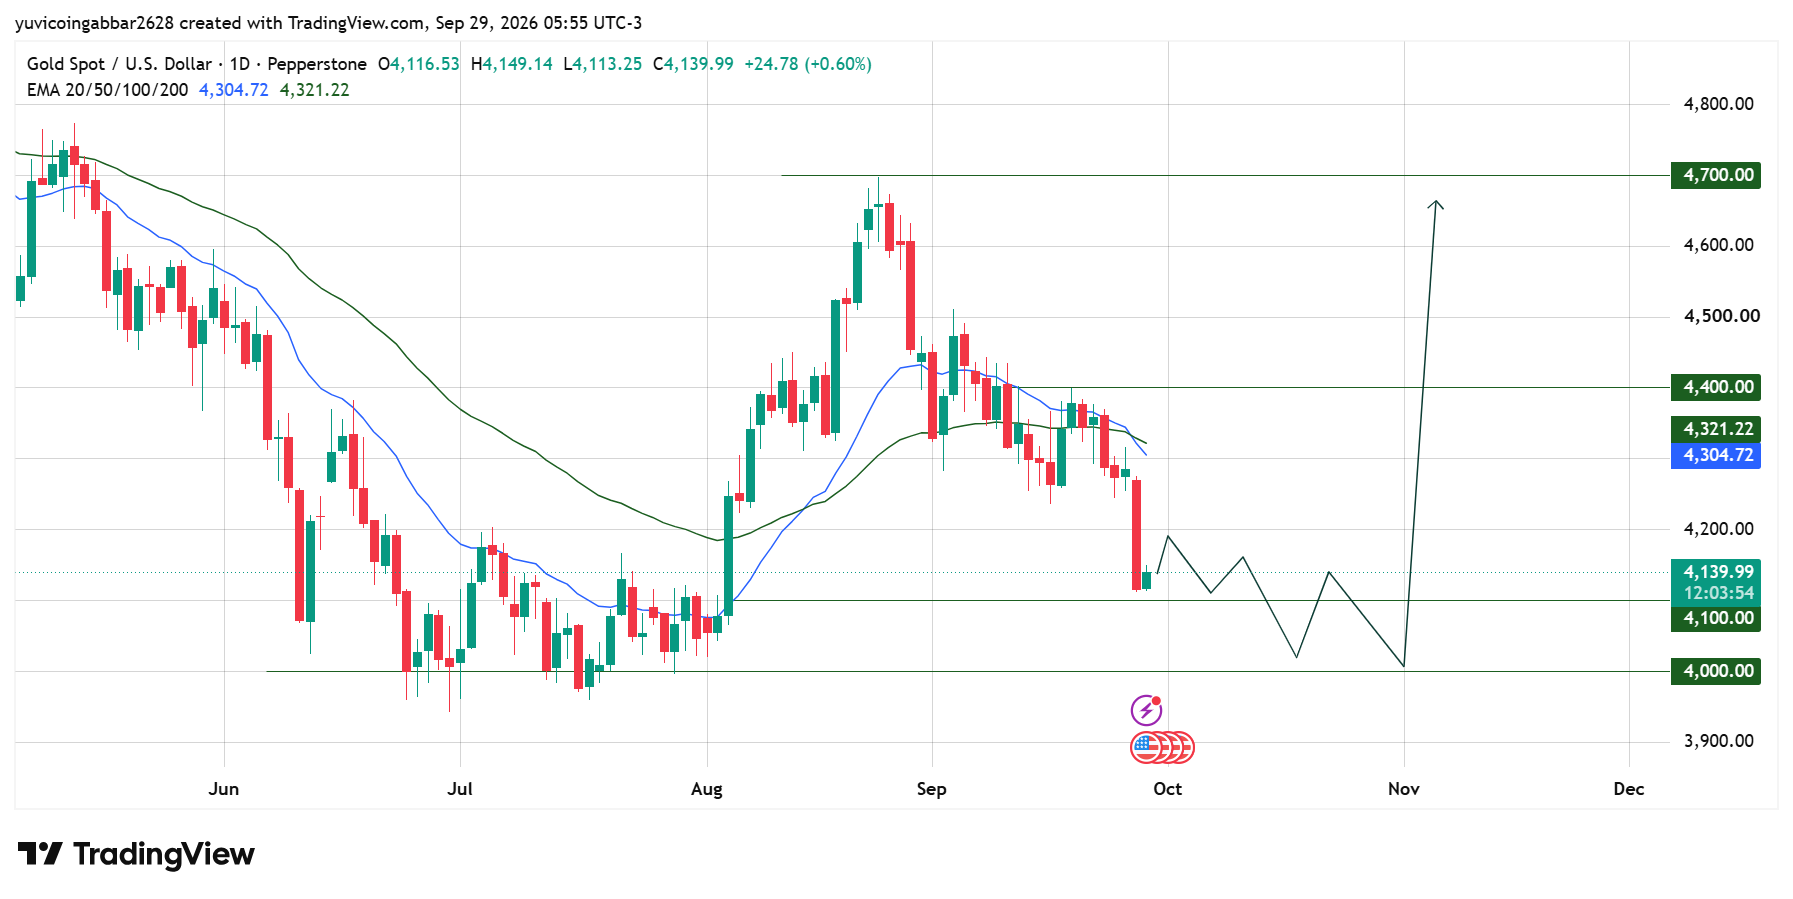
Since then, the price has drifted lower, and yesterday's candle broke that slide open completely, gapping down and closing near $4,116, right at the $4,100 support zone.
Today's candle is a small bounce, Gold price today is up 0.32% to $4,139.99, still sitting well below both EMAs.
The 20 EMA is at $4,304.72 and the 50 EMA at $4,321.22, and the 20 EMA has now crossed below the 50 EMA, a signal often read as confirmation that the short-term trend has turned down.
The gap between price and both EMAs is unusually wide after yesterday's drop, which often leads to some stabilization before the next real move.
Gold Key Levels
Level Type | Price |
Resistance 2 | $4,700.00 |
Resistance 1 (nearest) | $4,400.00 |
EMA Resistance Zone | $4,304.72 to $4,321.22 |
Immediate Price Reference | $4,139.99 |
First Confirmed Support | $4,100.00 |
Deeper Support | $4,000.00 |
Gold Price Forecast
Bull case: If the price holds $4,100.00, today's bounce could be the start of a stabilization after an extreme sell-off. A close back above the EMA zone near $4,321.22 would suggest buyers are stepping back in, with $4,400.00 as the next target after that.
Bear case: A close below $4,100.00 would open the door to $4,000.00, and given how rare and sharp yesterday's drop was, a break of $4,100.00 would suggest the selling pressure from rising yields and Iran-related tension hasn't fully played out yet.
Gold Price Prediction: Can Gold Reach $4,700?
$4,700.00 is the highest level marked on the chart, just above the early September high. To get there, gold would first need to hold $4,100.00, reclaim the EMA zone near $4,321.22, and then clear $4,400.00, a long path after a drop this large.
Gold Price Prediction 2026: Expert View
According to CoinGabbar analysts, a 3.4% single-day drop with a Z-score near -2.90 is not a routine pullback; it's a statistically rare event, and rare events like this often take more than one session to fully resolve.
The Iran-related energy story and rising yields both point in the same direction, toward pressure on gold, but the $4,100.00 zone has held so far. That level, not today's small bounce, is what will show whether the selloff is done.
Disclaimer
This piece is for informational purposes only and isn't financial advice. The levels and scenarios above are based on technical chart analysis and publicly available data at the time of writing. Gold prices can move sharply on macro and geopolitical news, so past patterns don't guarantee future outcomes. Do your own research and consider your risk tolerance before acting on any level discussed here.










.webp)











