Will PAX Gold Price Today Hold $4,250 Support or Break Down Next?


PAX Gold has just flashed a bearish EMA crossover on the daily chart, right as price sits on top of a support shelf it needs to defend.
This PAX Gold Price Prediction looks at whether the $4,250 support zone holds and the gold-backed token stabilises, or whether the pullback from the September high near $4,674 hits $5K or extends toward $4,000
PAX Gold Chart Alert: A Bearish EMA Crossover Just Fired
The chart carries its own annotation, flagging the signal directly: a bearish crossover between the 20 EMA 4,342.48 and the 50 EMA 4,347.45.
PAXG rallied hard from below $4,000 in early July to a high near $4,674 in early September before rolling over into the current consolidation zone.
Gold Price Prediction: Price Is Sitting Right on Support
Since the crossover, the price has been chopping inside a tight zone roughly between $4,250 and $4,300 today, visible on the chart as the highlighted band just below the current close.
That makes $4,250 the line in the sand: it's the last clearly defended level before a long, largely empty stretch of chart down to the $4,000.00 round number, which also lines up with the base of the July range.
PAXG Technical Analysis
Both EMAs now sit above the current price, having flipped from support into overhead resistance, the usual role-reversal seen when an uptrend stalls and consolidates.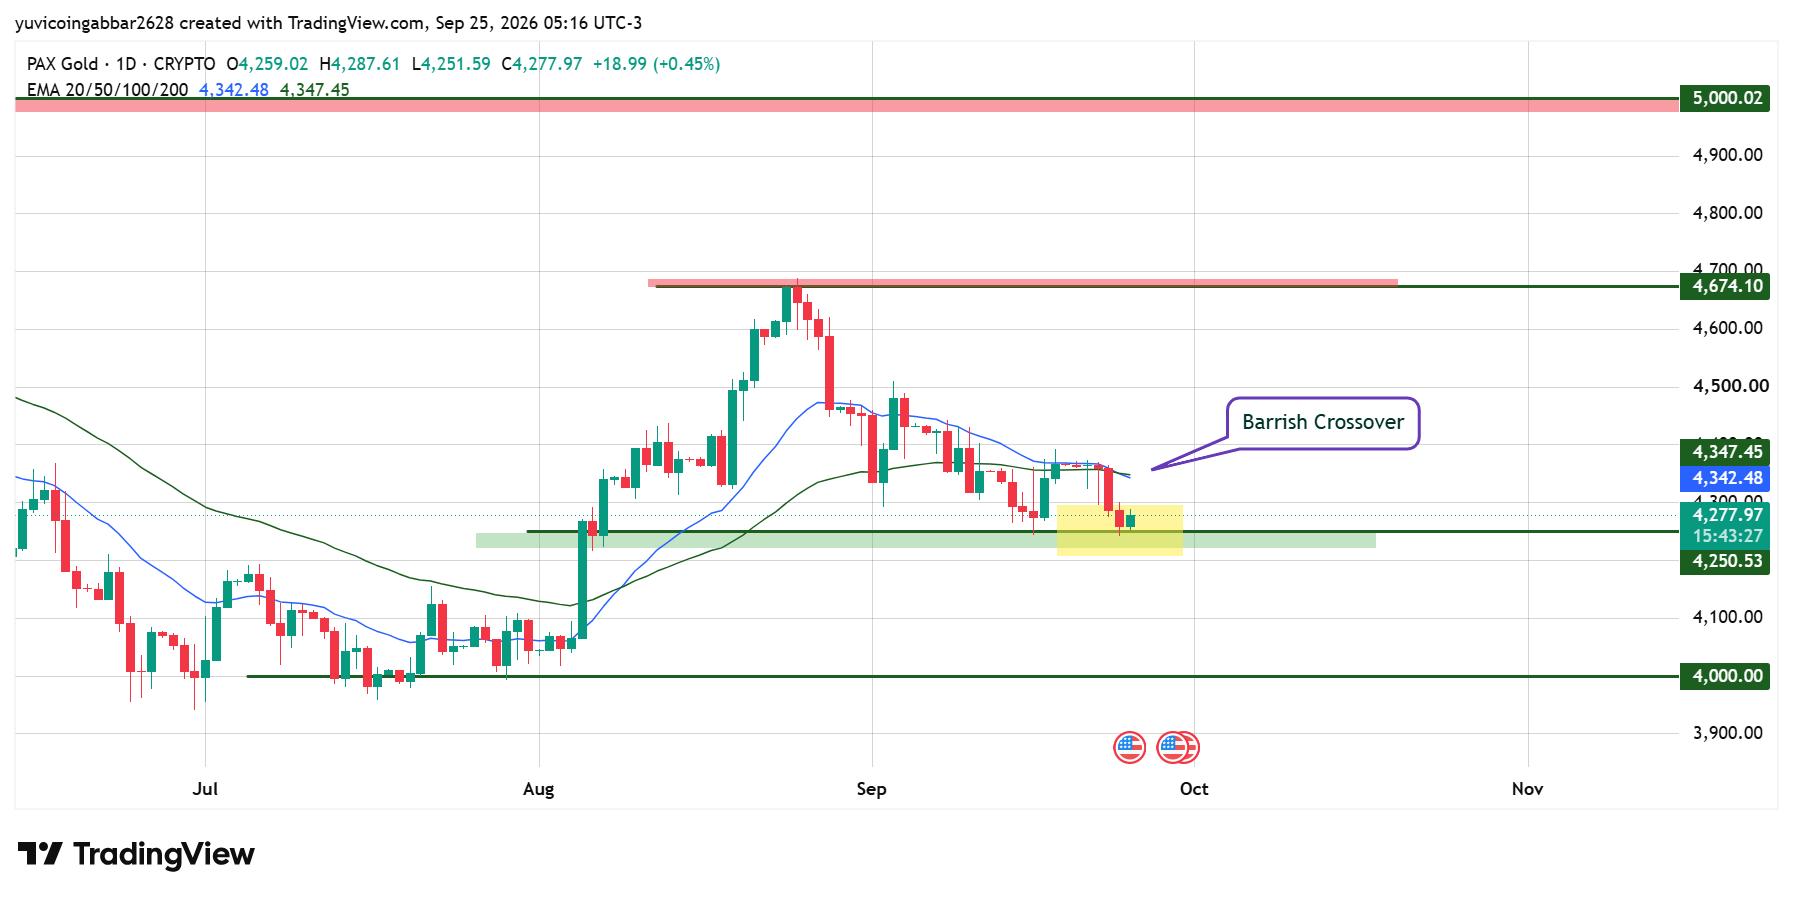
Gold price today is trading at $4,277.97, up 0.70% on the day, but still trading beneath both moving averages.
Gold Price Today Key Levels
| Level Type | Price |
| Major Resistance | $5,000.02 |
| Prior Swing High | $4,674.10 |
| $4,277.97 | |
| Major Support | $4,250.53 |
| Support | $4,000.00 |
Gold Forecast
Holding above $4,250.53 keeps this looking like a routine cool-off after a roughly 17% rally rather than a trend reversal.
A reclaim of the 4,342–4,347 EMA cluster would neutralise the bearish crossover and put the $4,674.10 swing high back in play.
A confirmed daily close below $4,250.53 would validate the crossover as more than short-term noise, and there's little chart structure between that level and $4,000.00 to slow a decline.
Gold Price Prediction: Can PAXG Reclaim $5,000?
$5,000.02 marks the major resistance visible on this chart, well above every other level here. Reaching it would require first reclaiming the EMA cluster near $4,345, then clearing the $4,674.10 prior high, meaning the immediate test is whether $4,250.53 holds, not whether $5,000 is realistic in the near term.
PAX Gold Price Prediction: Expert View
According to CoinGabbar analysts , a single bearish EMA crossover after a strong multi-month rally is common chart behaviour and not automatically a reversal signal, but it does shift the burden of proof onto the bulls.
As long as PAXG defends the $4,250.53 shelf, this reads as healthy consolidation under resistance rather than a breakdown. A confirmed close below it would leave little support standing before the $4,000.00 round number.
Disclaimer
This piece is for informational purposes only and isn't financial advice. The levels and scenarios above are based on technical chart analysis at the time of writing, and gold-backed crypto assets can move with both spot gold prices and broader crypto-market flows, so past patterns don't guarantee future outcomes. It's worth doing independent research and considering your own risk tolerance before acting on any of the levels discussed here.

















