XRP News Today: XRP Price Prediction October 2026 & $3.96M ETF Inflow

XRP is trading above $1.50 on September 29, up about 50% in the past month. The token has climbed over 70% since late August, when it traded near $1.00.
Fresh ETF flows are adding to the buzz. On September 28, Canary Capital's XRPC took in $3.96 million, and no other U.S. fund saw inflows that day.
Here is what the data shows, and where the price could go next.
What Is the Latest XRP News Today?
Binance futures are one driver. The monthly average open interest on Binance rose by nearly 1.3%, the strongest rise since August 2025.
Rising open interest can mean more traders are opening long and short bets. It can also rise just because prices go up, since open contracts are worth more.
The Binance Scarcity Index fell to its lowest point since January 2025. That points to more tokens available for trading on the exchange, which eases the tight supply seen since late 2024.
What Is the XRP Price Today?
Metric | Value |
Price | 1.5077(+2.09%,+0.03087) |
Market cap | $94.61 billion |
Futures volume (24h) | $5.27 billion (+5.23%) |
Spot volume (24h) | $1.24 billion |
Open interest | $3.46 billion (-1.18%) |
Circulating supply | 62.87 billion |
Total supply | 99.98 billion |
Max supply | 100 billion |
On the daily Binance chart, the latest candle opened at $1.4968 and traded between $1.4663 and $1.5142. It was printing near $1.5106 when the chart was captured.
Why Did Canary ETF Clients Buy $3.96 Million Worth of XRP?
Whale Insider posted the news on X. It was based on ETF flow data from the previous day.
SoSoValue confirmed a net inflow of $3.9585 million after U.S. markets closed on September 28. Canary was the only issuer in the green. About 2.65 million tokens came into its fund.
Bitwise, Franklin Templeton, and the other issuers posted flat flows.
Ticker | Issuer | Fund Price | Daily Change | 1-Day Inflow | Total Inflow | Net Assets |
XRP | Bitwise | $16.56 | -5.86% | $0 | $677.29M | $616.41M |
XRPZ | Franklin | $16.12 | -5.68% | $0 | $500.99M | $437.37M |
XRPC | Canary | $15.74 | -5.69% | $3.96M | $493.33M | $372.89M |
TOXR | 21Shares | $14.46 | -5.61% | $0 | -$21.15M | $160.22M |
GXRP | Grayscale | $28.76 | -5.61% | $0 | $145.38M | $97.10M |
Some analysts watch one-fund concentration as a demand signal. Others may say a single small print says little. Both views are fair.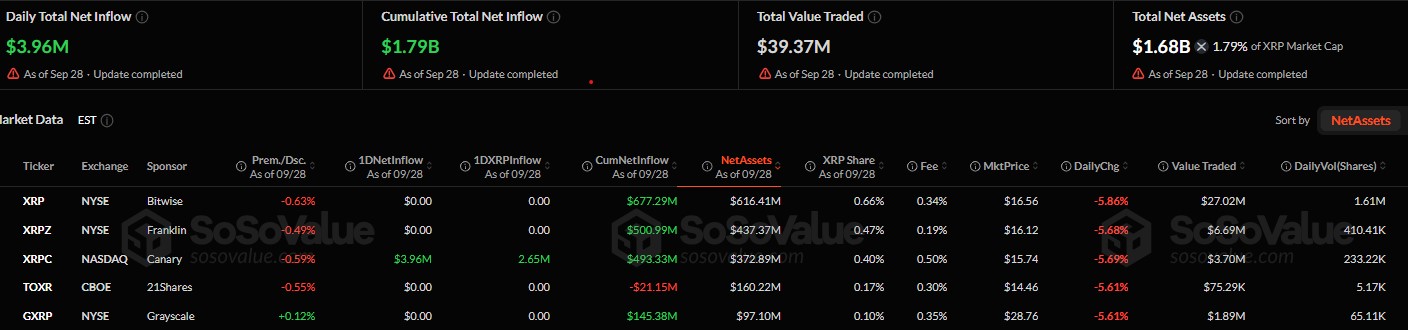
Are XRP ETF Inflows Rising or Slowing?
The week before looked different. Between September 22 and 25, spot XRP ETF inflows topped $75.6 million, led by Bitwise and Franklin. September 25 alone brought in $22.65 million.
Across all U.S. funds, lifetime net inflows sit near $1.79 billion. Total net assets are about $1.68 billion, or 1.79% of the token's market cap. Value traded on September 28 was $39.37 million.
Canary's cumulative inflow is now about $493.33 million. That it stayed positive while peers went quiet points to steady institutional interest, not a one-week story.
Still, demand looks uneven. One quiet day does not make a trend.
What Do XRP Futures and Options Data Show?
The picture is mixed. Open interest slipped 1.18% to $3.46 billion, while options volume jumped 40.73% to $6.05 million. Options open interest rose 7.30% to $66.39 million.
The overall long/short ratio is 0.9759, a bit under 1. Big exchanges tell a different story, with more accounts leaning long.
Long/Short Measure | Ratio |
Overall (24h) | 0.9759 |
Binance XRP/USDT (accounts) | 2.4083 |
OKX XRP (accounts) | 2.75 |
Binance top traders (accounts) | 2.7161 |
Binance top traders (positions) | 2.2367 |
How Many XRP Positions Were Liquidated in 24 Hours?
Total liquidations reached $8.86 million in 24 hours. Longs took most of the pain.
Period | Total | Long | Short |
1 hour | $73.52K | $4.79K | $68.73K |
4 hours | $534.96K | $65.41K | $469.55K |
12 hours | $3.58M | $2.95M | $632.28K |
24 hours | $8.86M | $6.67M | $2.19M |
In the last four hours, shorts took the hit instead. That kind of flip often shows a choppy market.
What Is the XRP Price Prediction Based on Support and Resistance?
On the daily chart, price sits above all four major moving averages. A widening, megaphone-style pattern stays intact while price holds above the $1.45 to $1.46 zone.
The RSI reads 57.73, with its signal line at 58.08. That is a mild bullish reading, not an overheated one.
Indicator | Level |
20 EMA | $1.4589 |
50 EMA | $1.3674 |
100 EMA | $1.3081 |
200 EMA | $1.3705 |
Zone | Type | What It Means |
$1.45 to $1.46 | Support | Key zone, near the 20 EMA |
$1.37 to $1.40 | Support | Retest area if $1.46 breaks |
$1.55 to $1.60 | Resistance | First hurdle for buyers |
$1.65 to $1.70 | Resistance | Next target on a breakout |
$1.80 | Resistance | Higher target area |
The September high on the chart sits near $1.66, and the late August spike touched about $1.70. Sellers stepped in at both spots before.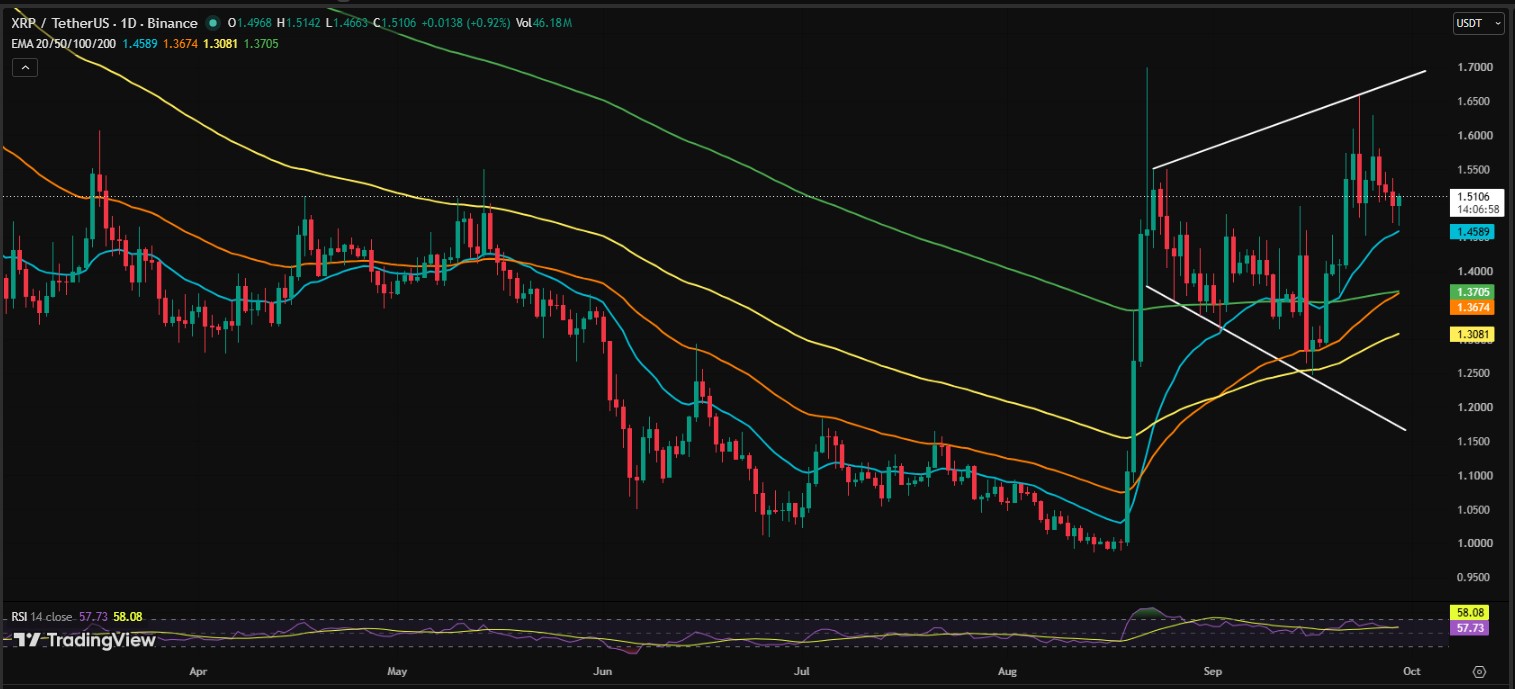
What Is the XRP Price Forecast: Bullish or Bearish?
Bullish case: A sustained move above $1.55 to $1.60 could open the way toward $1.65 to $1.70. After that, traders may look at the $1.80 area.
Bearish case: A firm break below the 20 EMA near $1.46 would weaken the structure. A retest of $1.37 to $1.40 could follow, where the 50 EMA and 200 EMA sit close together.
Sideways case: Price may also chop between $1.46 and $1.60 for a while.
None of these paths are certain. Crypto moves fast, and one headline can change the mood.
Will XRP Hit a New All-Time High by the End of 2026?
The Scarcity Index is at its lowest since January 2025, so supply on Binance is less tight. Market sentiment now shows a reduced chance of a new all-time high by the end of 2026.
That can change if ETF demand picks up or if price clears $1.80. For now, the data does not point clearly either way.
What Should Traders Watch Next in Crypto News Today?
Watch the daily close against $1.46. Watch whether Bitwise and Franklin flows return after a flat day.
Also track open interest and liquidations for signs of crowded trades. Check XRP's latest news and wider crypto news today, since one headline can shift the market fast.
Disclaimer
This article is for information only and is not financial, investment, or trading advice. Crypto assets are highly volatile, and prices can fall as fast as they rise. Price levels and scenarios above are not guarantees. Do your own research and speak with a licensed financial advisor before you invest. Never risk money you cannot afford to lose.










.webp)











