Litecoin Price Prediction: Can $LTC Hit $100 in 2026? Here’s Why


LTC broke out of a months-long sideways range and is now holding just above the old resistance it just cleared.
This Litecoin price prediction looks at whether $67.038 holds as support and LTC pushes on toward $84.186.
Litecoin News: LTC Sees Steady Cross-Chain Swap Demand
A widely shared social media post about Thorchain, a cross-chain swap platform, said it generated $1.2B in total volume over the past week, citing DefiLlama data, and described itself as a leading venue for converting between assets like LTC, AVAX, XRP, and ZEC, as well as memecoins like DOGE.
LTC was named as one of several supported assets rather than the focus of the post, so this is limited, general context rather than LTC-specific news.
CoinGabbar could not independently verify the $1.2B volume figure, as it wasn't linked to a specific DefiLlama page.
Litecoin Technical Analysis
LTC spent most of July and August moving sideways between roughly $44 and $48.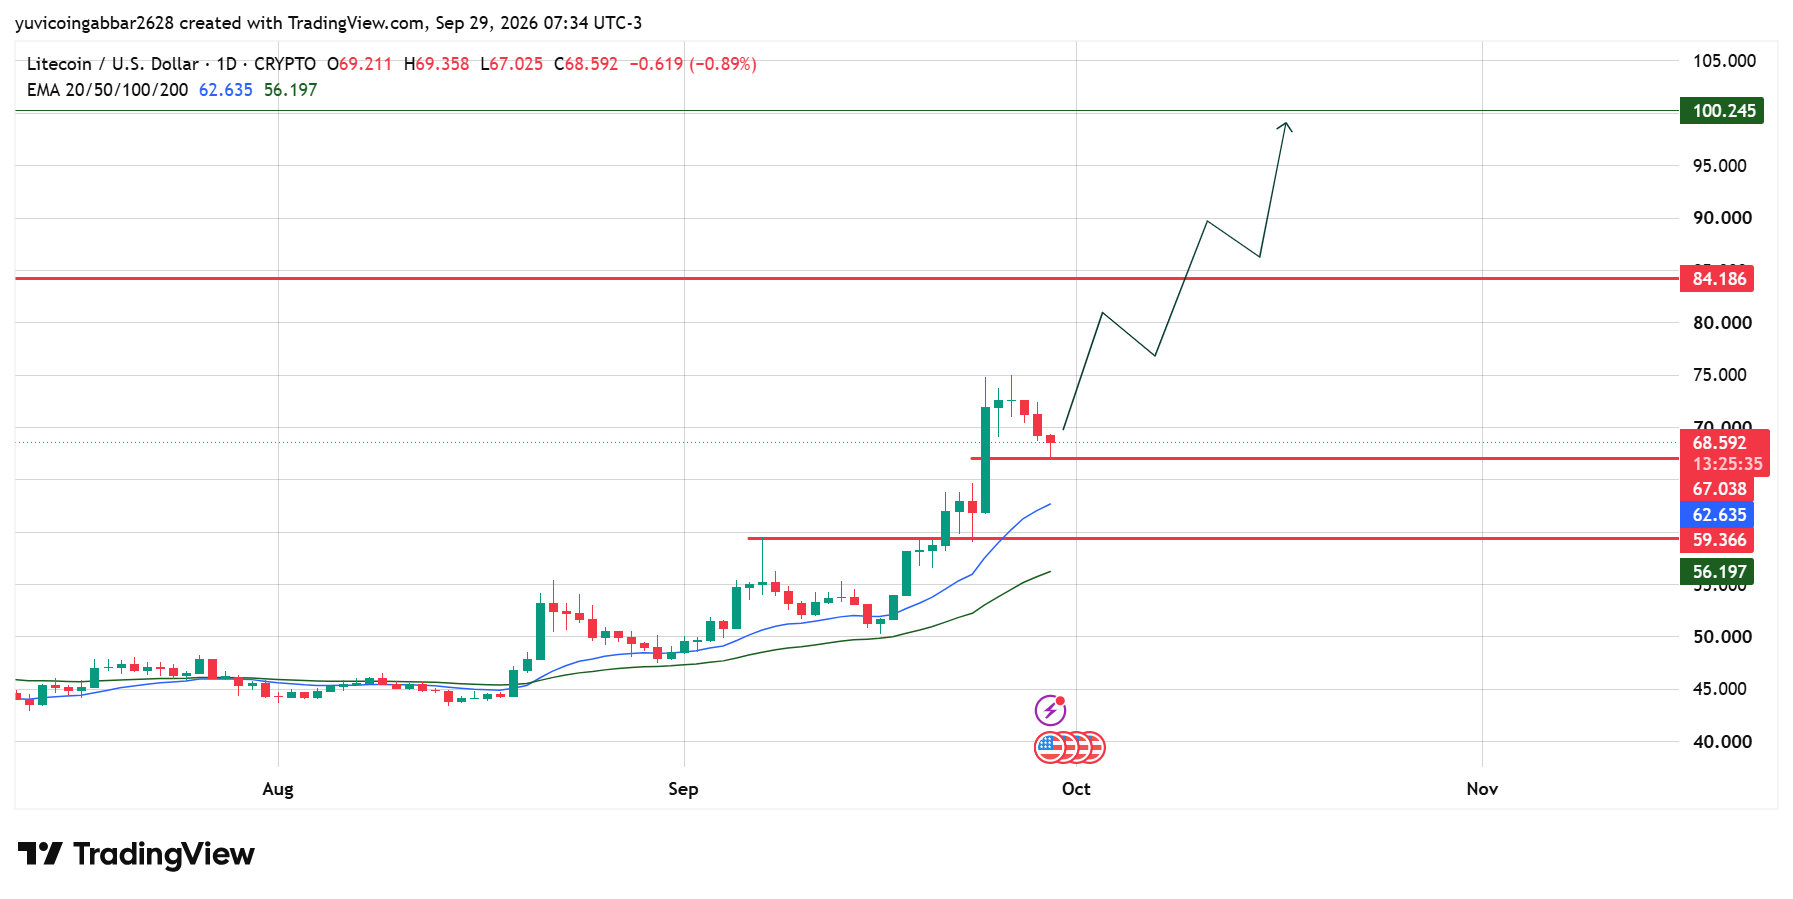
In September, that range broke to the upside, and price climbed steadily to $59.366, then broke above that level too, and jumped sharply to a high near $69.36 in the past few sessions.
The Litecoin price today is down 2.5% to $68.592, holding just above the $67.038 level. That level marks the base of the most recent breakout candle, so it's the first real test of whether this jump can hold or whether it was a short-term spike.
Both EMAs sit well below the current price of $68.592. The 20 EMA is at $62.635 and the 50 EMA at $56.197, both trending upward, which confirms the broader trend has turned up since the September breakout began.
Support and Resistance Levels
Level Type | Price |
Resistance 2 | $100.245 |
Resistance 1 | $84.186 |
Immediate Price Reference | $68.592 |
First Confirmed Support | $67.038 |
Deeper Support | $59.366 |
The Litecoin Forecast
Bull case: If the price holds at $67.038, this breakout looks like it's consolidating rather than failing. A close above the recent high near $69.36 would open the way toward $84.186, with steady cross-chain swap demand adding some background support.
Bear case: A close below $67.038 would risk a slide back toward $59.366, the level LTC broke out from just days ago. Losing that level would suggest the whole September breakout was a false move rather than a genuine trend change.
Litecoin Price Prediction: Can Litecoin Reach $100?
$100.245 is the highest level marked on the chart. To reach it, LTC must first hold $67.038, then clear $84.186, a level almost 25% above the current price.
That would need the September breakout to keep building rather than just holding steady.
Litecoin Price Prediction 2026: Expert View
According to CoinGabbar analysts, breaking out of a two-month range and then holding above the old resistance, rather than falling straight back into it, is a healthy sign so far.
The real test is whether $67.038 keeps holding on the next dip, since that would confirm buyers are defending the breakout rather than just riding the initial spike.
Disclaimer
This piece is for informational purposes only and isn't financial advice. The levels and scenarios above are based on technical chart analysis and publicly available data at the time of writing. Crypto markets can move sharply within hours, so past patterns don't guarantee future outcomes. Do your own research and consider your risk tolerance before acting on any level discussed here.










.webp)











