Litecoin Price Prediction: Can $LTC Hit a New All-Time High?


Litecoin just crossed $279M in daily trading volume, right as the price pulled back from a fresh high near $53.38.
$LTC is still up sharply from its early September lows, and volume keeps climbing even as price cools off.
Dip buyers are watching closely. Is this Litecoin price prediction pullback a chance to load up before the next leg, or is momentum starting to fade?
Market data was checked on September 10, 2026, at 12:57 IST.
Litecoin Price Prediction Today: Market Overview
Metric | Value |
Price | $52.436 |
24h Change | -4% |
Market Cap | $4.07B (-3.64%) |
FDV | $4.41B |
24h Volume | $281.92M (-5.5%) |
Vol/Mkt Cap (24h) | 6.86% |
Total Supply | 84M LTC |
Max Supply | 84M LTC |
Circulating Supply | 77.59M LTC |
Holders | 117.7K |
Source: Data from CoinMarketCap as of September 10, 2026, at 12:57 IST. Figures may vary slightly across other tracking websites.
Litecoin Liquidation Data: Futures Rekt Report
Liquidation and volume figures below are pulled from futures markets and kept separate from spot activity.
Source: Data From CoinGlass
Window | Total Rekt | Long | Short |
1h | $218.61 | $218.61 | $0 |
4h | $22.81K | $22.81K | $0 |
12h | $615.05K | $611.00K | $4.05K |
24h | $805.97K | $792.02K | $13.96K |
The 12h and 24h windows show almost all of the liquidations came from longs, lining up with the sharp pullback from the recent $53.38 high.
Futures volume is led by Binance at $95.01M, followed by BingX ($60.50M), OKX ($36.27M), Bybit ($28.37M), and WhiteBIT ($20.70M), with smaller volume spread across LBank, Bitget, MEXC, Gate, Bitunix, and KuCoin.
LTC Crypto News Today: Volume Surpasses $279M
Trader @criptoovar flagged that Litecoin surpassed $279M in 24-hour trading volume, a figure that lines up closely with the broader volume spike seen on the market tracker. 
Source: Data From X
This is a social-media-sourced figure and should be treated as an estimate alongside the tracker's own $281.92M reading rather than a single confirmed total.
Litecoin Price Prediction Chart: Technical Analysis
Pair: LTC/USD · Market: Spot (Crypto) · Exchange: TradingView · Timeframe: 1D · Timestamp: September 10, 2026, 12:57 IST
LTC opened at $53.197, ran to a high of $53.381, dipped to $52.423, and closed at $52.436, down 4% on the day.
Price has been climbing inside two rising trendlines since early June, forming a widening rising wedge structure, and the recent pullback from $53.381 is happening right at the upper boundary of that structure.
The EMA20 sits at $51.288, with the EMA50 just below at $49.025, both still acting as support beneath the current pullback.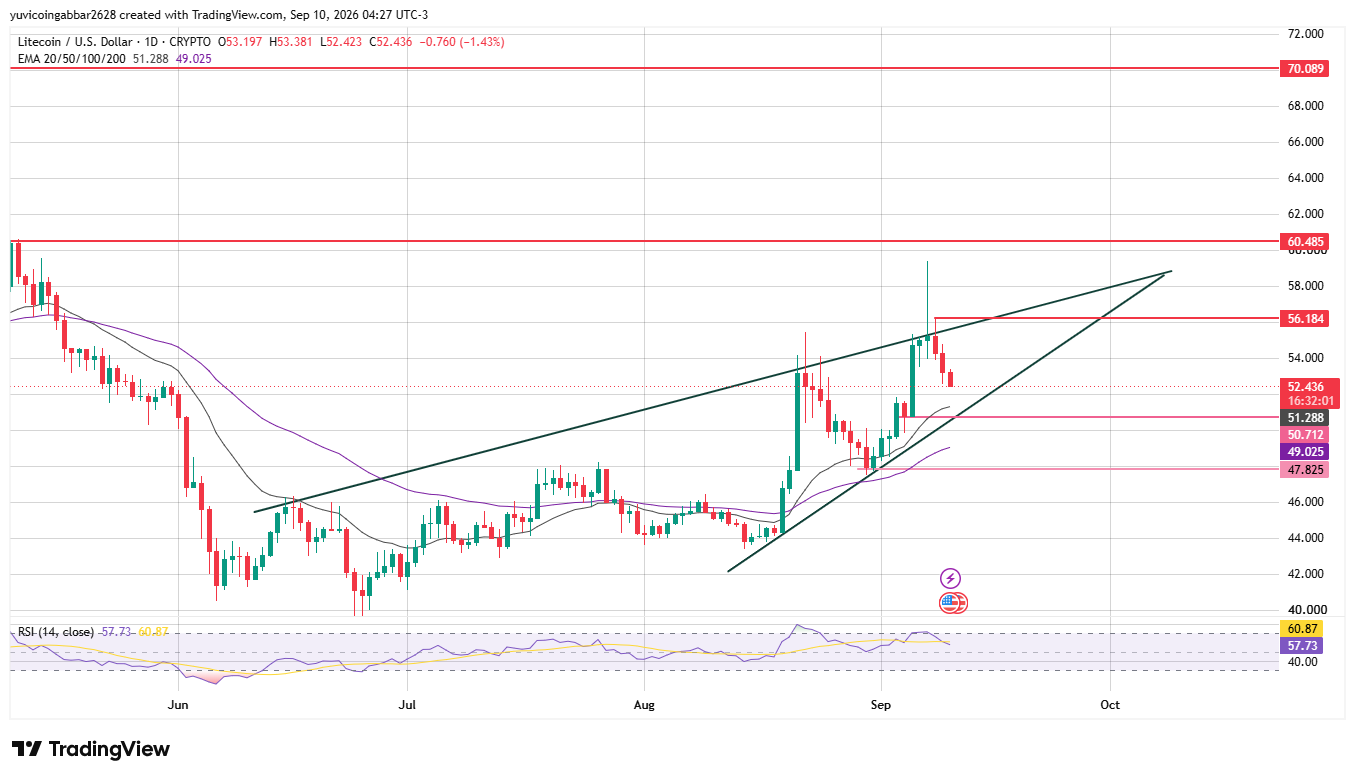
Support and Resistance Levels
Level Type | Price |
Resistance 3 | $70.089 |
Resistance 2 | $60.485 |
Resistance 1 (nearest) | $56.184 |
Immediate Price Reference | $52.436 |
First Confirmed Support | $50.712 |
Deeper Support | $47.825 |
Litecoin Forecast: Bull Case vs Bear Case
Bull case: Holding above $50.712 and the EMA20 at $51.288 would keep the current uptrend structure intact. A confirmed move above $56.184 would open room toward $60.485 and eventually $70.089.
Bear case: A break below $50.712 followed by a close under the EMA50 at $49.025 would suggest the pullback is turning into a deeper correction. Losing $47.825 would put the broader recovery from early September at risk.
Litecoin Price Scenarios: Triggers and Invalidation
Scenario | Trigger | Likely Outcome | Invalidation Point |
Continuation | Close above $56.184 | Move toward $60.485 | Close back below $50.712 |
Consolidation | Range between $50.712–$56.184 | Sideways chop before next leg | Break of either boundary |
Reversal | Close below $47.825 | Slide toward deeper support | Reclaim of $50.712 |
Can LTC Reach $70.089?
$70.089 is the highest resistance level marked on the chart. Getting there would require LTC to clear $56.184, then $60.485, in stages, with each level needing to flip from resistance to support along the way.
Litecoin Price Prediction: Bitcoin's Role in the Bigger Picture
Broader market direction still matters here.
Most Bitcoin price prediction outlooks for the current cycle see Bitcoin holding its range as a key condition for large-cap coins like LTC to keep building on recent gains, since a sharp Bitcoin drop tends to drag established names like Litecoin down alongside it.
Litecoin Price Prediction 2026: Expert View
According to CoinGabbar analysts, LTC's pullback from $53.381 is happening right at the top of a multi-month rising wedge, with both EMAs still holding as support underneath. The $50.712 to $56.184 zone is the range to watch this week for the next real move.
Disclaimer: This piece is for informational purposes only and isn't financial advice. The levels and scenarios above are based on technical chart analysis and publicly available data at the time of writing, and crypto markets can move sharply within hours, so past patterns don't guarantee future outcomes. It's worth doing independent research and considering your own risk tolerance before acting on any of the levels discussed here.

















