Silver Price Prediction Today: Can XAG/USD Hold $59.432 Support?


Silver price prediction today is the question on every metals trader's screen, and a fresh macro take has pushed the debate into overdrive.
The chart is sending a signal that runs against the recent mood, and the news adds another layer.
Here is the 1-hour chart read, using market data available on Sep 29, 2026.
Our editorial desk holds no personal position in XAG. This is purely a chart and data read.
Silver Price Today: Live XAG/USD Price, RSI, and Momentum Data
XAG is priced near $60.661 on the TradingView chart (Silver vs. U.S. Dollar, 1-hour, FOREX.com). The latest 1-hour candle opened at $60.621, reached $60.678, dipped to $60.618, and is up 0.07%.
The chart shows XAG has fallen from above $66 earlier in the week, so the XAG price today sits well below those levels.
The RSI (relative strength index, a 0 to 100 momentum gauge) reads 37.20. That is below the midpoint but above the 30 mark traders call oversold, so selling momentum has cooled without buyers taking control.
Source: TradingView, FOREX.com, Sep 29, 2026, 15:31 UTC+5:30.
Silver News Today: Peter Schiff on Yields and Real Rates Impact
Economist Peter Schiff (@PeterSchiff), a well-known gold advocate, posted on X early on Sep 29 that rising bond yields hit XAU and XAG hardest that day, but that traders have it wrong. 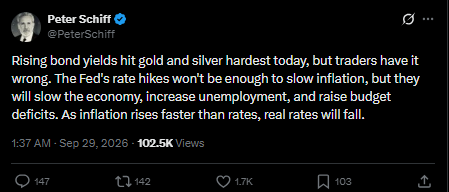
His argument has three parts. Fed rate hikes, in his view, will not be enough to slow inflation.
They will, however, slow the economy, increase unemployment, and raise budget deficits. And because inflation is rising faster than rates, real rates will fall.
What the terms mean. A bond yield is the return on a government bond. XAG pays no interest, so when yields rise, holding it costs more in missed income, and that tends to push its price down. Real rates are interest rates minus inflation. When they fall, metals like silver usually look better.
Possible impact on silver.
In the short term, higher yields explain part of the recent drop. If yields keep climbing, pressure on XAG could continue, and $59.432 is where that would show up on the chart.
If his real-rate view proves right, the pressure should ease and support XAG over time.
Rising unemployment and deficits are often cited as reasons investors move toward hard assets. But XAG is also an industrial metal, so a weaker economy can cut demand and cancel some of that support.
This is one commentator's opinion, not data, and the result depends on inflation and rates that no post can confirm.
Source: Peter Schiff on X, Sep 29, 2026.
Silver Price Prediction Today Quick Take: Key Levels and Triggers
CMP: $60.661
Breakout trigger: 1-hour close above $61.812
Key support: $59.432
Bullish shakeout signal: wick below $59.432 that closes back above it
Failure level: 1-hour close below $59.432
Data time: Sep 29, 2026, 15:31 UTC+5:30
Risk note: this is a 1-hour setup, so it can change fast
Silver Price Prediction Today Technical Analysis on the 1H Chart
Methodology: 1H timeframe, FOREX.com spot silver, marked support and resistance levels, and the chart RSI divergence labels. The setup weakens on a 1-hour close below $59.432.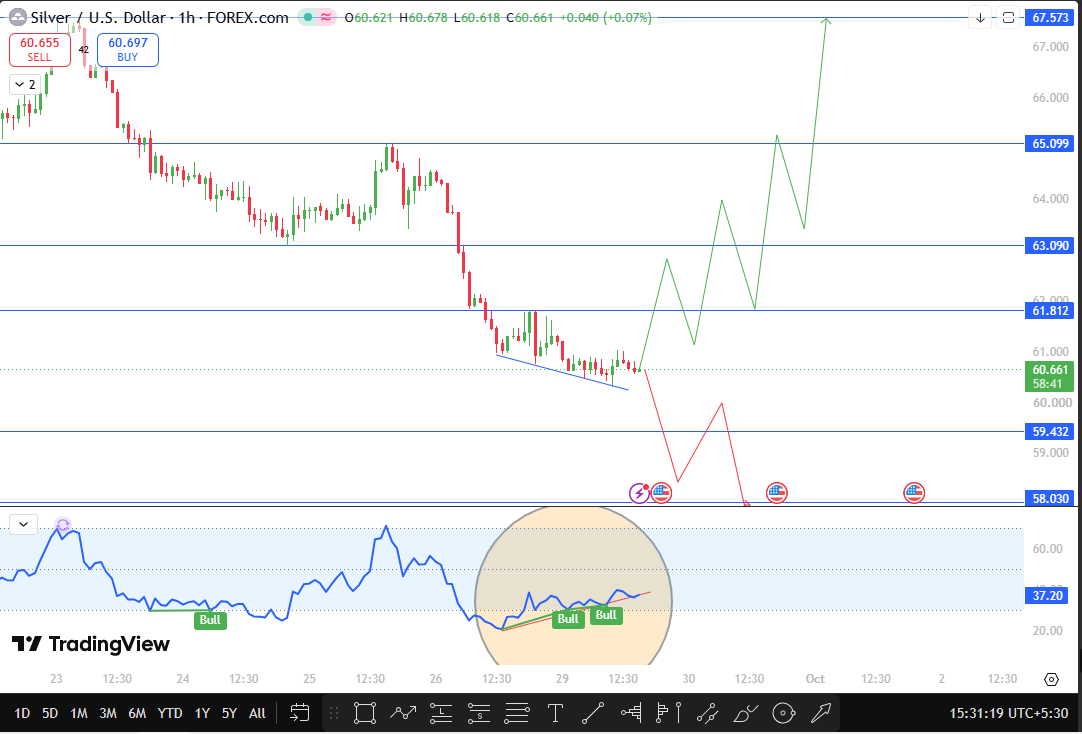
Price is still making lower lows, but the RSI is making higher lows. That mismatch is called bullish divergence, and the chart marks it with green labels. It says selling pressure is losing strength even as price slips.
The last time the chart flagged this, around Sep 24, price bounced to the $65 area. Divergence is a warning that a bounce may come, not a promise.
The $61.812 level matters most. It marks the top of the last small rebound inside this decline. A 1-hour close above it would be the first higher high after the fall, and the first sign the trend is turning.
There is also a shakeout scenario. If a wick pushes below $59.432 and the price closes back above it, that would show sellers were trapped, and aggressive buying could follow.
The projected paths on the chart show two routes for the silver price forecast. In one, the price bounces, steps up through $63.090 and $65.099, and heads for $67.573 over the next few days. In the other, the price loses $59.432, bounces briefly, and slides to $58.030.
Source: TradingView, 1H FOREX.com, Sep 29, 2026, 15:31 UTC+5:30.
Silver Support and Resistance Levels: Key XAG/USD Price Targets
Level | Type | Distance from CMP |
$67.573 | Major resistance | +11.4% |
$65.099 | Resistance | +7.3% |
$63.090 | Resistance | +4.0% |
$61.812 | Breakout trigger | +1.9% |
$60.661 | CMP | 0% |
$59.432 | Key support | -2.0% |
$58.030 | Next support | -4.3% |
Silver Price Forecast: Bull, Base, and Bear Scenarios Explained
Bull case. Price closes an hour above $61.812 and keeps going. Next comes $63.090, about 4% higher, then $65.099, about 7% higher, and finally the major $67.573 resistance, about 11% higher. A fall in real rates, as Schiff argues, would help this case.
Base case. Price moves sideways between $59.432 and $61.812 while RSI recovers and yield pressure lingers. Quiet action here would be normal after a fall this sharp.
Bear case. Sellers close an hour below $59.432. That puts $58.030 in play, roughly 4% below today's price. A wick below $59.432 that closes back above it would cancel this case.
Key Risks to the Silver Price Forecast: What Could Go Wrong Next
If bond yields keep rising, XAG could keep falling regardless of the chart. The Schiff post is opinion, so its call on real rates may not play out. Divergence signals often fail in strong downtrends.
The chart also marks several upcoming US economic events over the next few days, and data surprises can move XAG quickly. A 1-hour setup can flip within a day.
Silver Price Forecast Disclaimer: This Is Not Financial Advice
This article is for information and education only and is not financial advice. Commodity and crypto markets are volatile, and you can lose money. Do your own research before making any decision.








.webp)













