Litecoin Price Prediction: $LTC Could Explode If $48 Breaks


Litecoin launched back in 2011 as one of the earliest Bitcoin forks, built to move faster and cheaper while still leaning on the same proof-of-work foundation.
It's carried the "silver to Bitcoin's gold" label ever since, staying relevant through more than a decade of cycles other coins never survived.
That longevity has kept it a fixture on nearly every major exchange, with deep liquidity that newer tokens rarely match this early in their life.
In this Litecoin price prediction, $LTC is currently trading at $44.51, down 0.6% over the last 24 hours, after moving between $44.45 and $44.96 during the session.
Live Market Data
Before getting into where this Litecoin price prediction leans, here's the current market snapshot for $LTC, straight from live data rather than a stale feed. These figures set the backdrop for everything in the technical read below.
| Metric | Value |
|---|---|
| Price | $44.51 |
| 24h Change | -0.6% |
| 24h Range | $44.45 – $44.96 |
| Market Cap | $3.45B |
| Fully Diluted Valuation | $3.45B |
| 24h Volume | $129.003M |
| Circulating Supply | 77.494M |
| Total Supply | 77.494M |
| Max Supply | 84M |
| Total Treasury Holding | 976,386 LTC |
Source: $LTC market cap data taken from Coingecko, data as of Aug 14, 2026. Figures may vary slightly across other tracking websites.
Exchange Volume
LTC's 24-hour trading volume totals $129.003M, and BingX leads the pack by a wide margin at $85.99M, well ahead of Binance at $26.11M and WhiteBIT at $24.81M.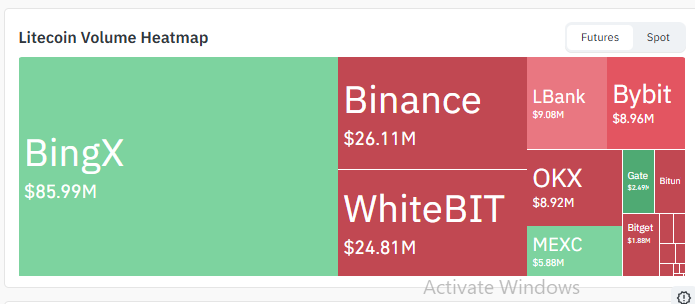 Source: Liquidation Data Taken From Coinglass.
LBank, Bybit, and OKX each sit closer to the $9M mark, with MEXC, Gate, and Bitget contributing smaller amounts further down the list.
That kind of concentration on one venue means BingX order flow specifically is worth watching if this trendline test actually resolves one way or the other.
It's also worth noting Litecoin's total treasury holding sits at 976,386 $LTC, a figure worth tracking alongside volume for anyone watching supply-side pressure over the coming weeks.
Key Takeaways
-
Litecoin is trading at $44.51, down 0.6% over the last 24 hours
-
Daily chart shows LTC testing a rising trendline for the third meaningful time
-
The Wolfe Wave pattern projects a move toward $49.52 if the bounce holds
-
BingX leads 24h volume at $85.99M out of $129.003M total
-
No liquidation heatmap was part of this chart set
Technical Analysis
Daily Chart Analysis for Litecoin Price Prediction
The daily chart has $LTC respecting a rising trendline that's supported every dip since the recent low, and price is once again testing that same line right now. 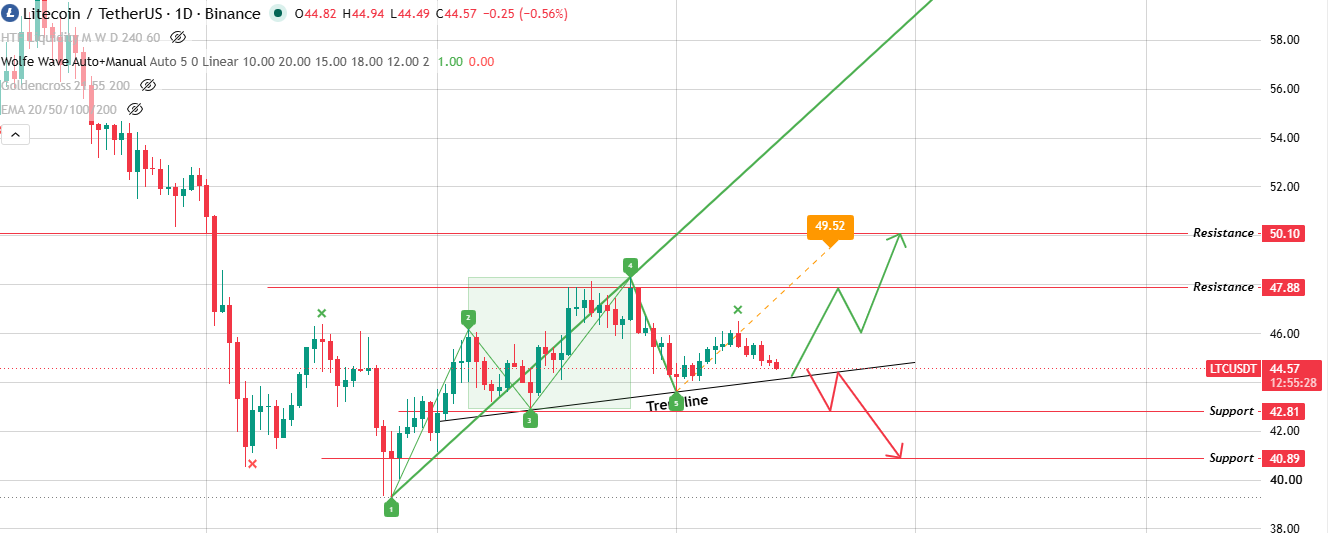
Source: Chart Taken From TradingView.
This is now the third meaningful touch on this trendline, and each prior test has produced a bounce rather than a break, which adds weight to the idea buyers keep showing up here.
A bounce with volume behind it puts the first resistance at $47.88 in play, and clearing that opens the door to $50.10 next.
The Wolfe Wave structure on this timeframe backs that same read, projecting a move toward the upper zone, with the pattern's level lining up close to $49.52.
Break the trendline instead, and a slide toward $42.81 first, then $40.89, becomes the more likely path.
Litecoin Support & Resistance Levels
| Timeframe | Support 1 | Support 2 | Resistance 1 | Resistance 2 |
|---|---|---|---|---|
| Daily | $42.81 | $40.89 | $47.88 | $50.10 |
Bull, Base, Bear Case
This Litecoin price prediction comes down to a single line on the daily chart, since the price is right back at the rising trendline that's held up every pullback so far.
Whether it holds one more time decides which scenario plays out for Litecoin, and the table below lays out both paths with the exact levels involved.
| Scenario | Price Level | Conditions | Invalidation |
|---|---|---|---|
| Bull Case | $47.88 – $50.10 | Bounce from the rising trendline with volume, confirmed by the Wolfe Wave projection | Break of the trendline and close below $44.45 |
| Base Case | $42.81 – $47.88 | Price holds above the trendline without a decisive break in either direction | Close outside either the trendline or first resistance |
| Bear Case | $42.81 – $40.89 | Break of the rising trendline with rising sell volume | Reclaim of the trendline with strong volume |
Pattern Context
Repeated trendline touches like this one carry a bit of a trade-off worth flagging in any Litecoin price prediction.
Each successful bounce builds confidence in the line, but it also means the line is statistically closer to eventually failing than it was on the first test.
That doesn't make a break more or less likely on this specific attempt; it just means position sizing around this level deserves extra care compared to a fresh trendline with no prior tests behind it.
Glossary
Rising Trendline: a support line drawn beneath a series of higher lows, tracking the pace of an uptrend.
Resistance Level: a price zone where selling pressure has historically stepped in and stalled upward moves.
Support Zone: a price area where buyers have repeatedly stepped in to catch falling prices.
Wolfe Wave: a five-wave pattern traders use to estimate where price is likely to travel toward next.
Methodology
This prediction was built from daily chart analysis submitted for review and cross-checked against live market data and exchange volume distribution. No liquidation data was part of this chart set. No price levels were extrapolated beyond what appeared in the source chart.
Disclaimer: This article is for informational purposes only and does not constitute financial advice. Cryptocurrency markets are highly volatile, and past chart patterns don't guarantee future outcomes. Always do your own research and consult a licensed financial advisor before making investment decisions.
Also read:

















