AKEDO Price Prediction: $AKE Trendline Hold or Another Decline Coming?


AKEDO is down over 20% today and has landed right on a rising trendline that has held since mid-July, making this a genuine make-or-break moment for the chart.
The project is an AI-native content creation engine that lets creators build games and digital assets using text prompts, with AKE powering fees, staking, and governance across the platform.
This AKEDO Price Prediction looks at what happens next: Here's the full breakdown.
AKE price: AKE Market Overview
Metric | Value |
Price | $0.0038839 |
24h Change | −20% |
Market Cap | $88.72M (−20%) |
24h Volume | $31M (−60.06%) |
Vol/Mkt Cap (24h) | 35.58% |
FDV | $389.08M |
Liq/Mkt Cap | 1.50% |
Total Supply | 100B AKE |
Max Supply | 100B $AKE |
Circulating Supply | 22.79B $AKE |
Holders | 37.09K |
Source: Data from CoinMarketCap as of 29/07/2026. Figures may vary slightly across other tracking websites.
Liquidation and Volume Data
Coinglass data shows $1.18M in total liquidations over 24 hours, split roughly evenly between longs ($577.01K) and shorts ($605.03K), a sign of two-sided volatility rather than a one-directional squeeze.
The pace picked up sharply in the last 4 hours, with $150.56K rekt (mostly longs at $117.27K), suggesting recent selling caught late buyers off guard. 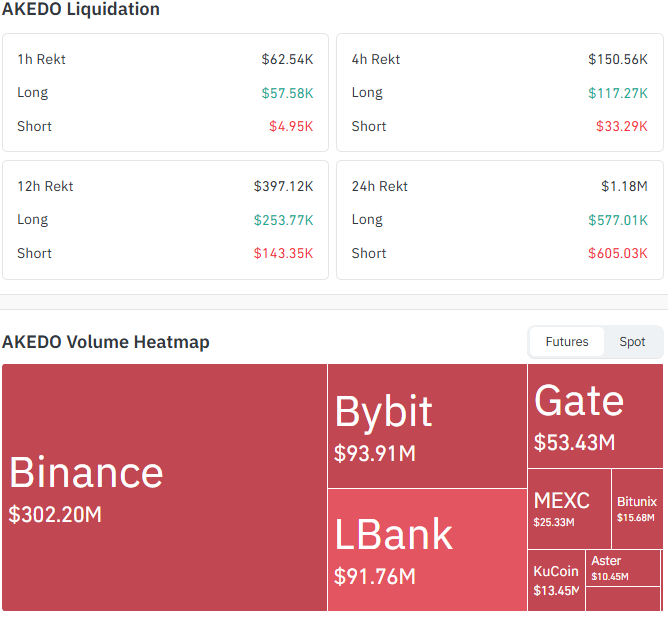
Source: Data From CoinGlass
On the exchange side, futures volume is heavily concentrated on Binance ($302.20M), followed by Bybit ($93.91M) and LBank ($91.76M), with smaller volume spread across Gate, MEXC, Bitunix, KuCoin, and Aster.
This futures activity is separate from the $31M in CoinGecko spot volume shown above.
AKEDO Price Prediction 2026: Chart Analysis
Pair: AKEDO/USD · Market: Spot · Timeframe: 4H candles · Source: TradingView · Timestamp: July 29, 2026, 10:28 UTC+5:30
AKE is trading at $0.0038839, down 20% in 24 hr, and the price is sitting directly at an important level, the rising trendline that has supported every pullback since the breakout rally.
The short-term EMA sits almost exactly at current price ($0.0038414), reinforcing this zone as a genuine decision point.
RSI (14) at 53.84 is neutral, showing neither strong bullish nor bearish momentum right now. The trendline test, not the indicator, is what matters most here.
If the trendline breaks, the levels below come into focus in order: $0.0037245 first, then the longer EMA and support near $0.0030981, followed by $0.0028843 and a deeper floor at $0.0020441.
If AKE holds above the ascending trendline support, it could rally toward the first resistance at $0.0042218. A breakout above this level may open the door to $0.0048731, with the next major upside target at $0.0063408. 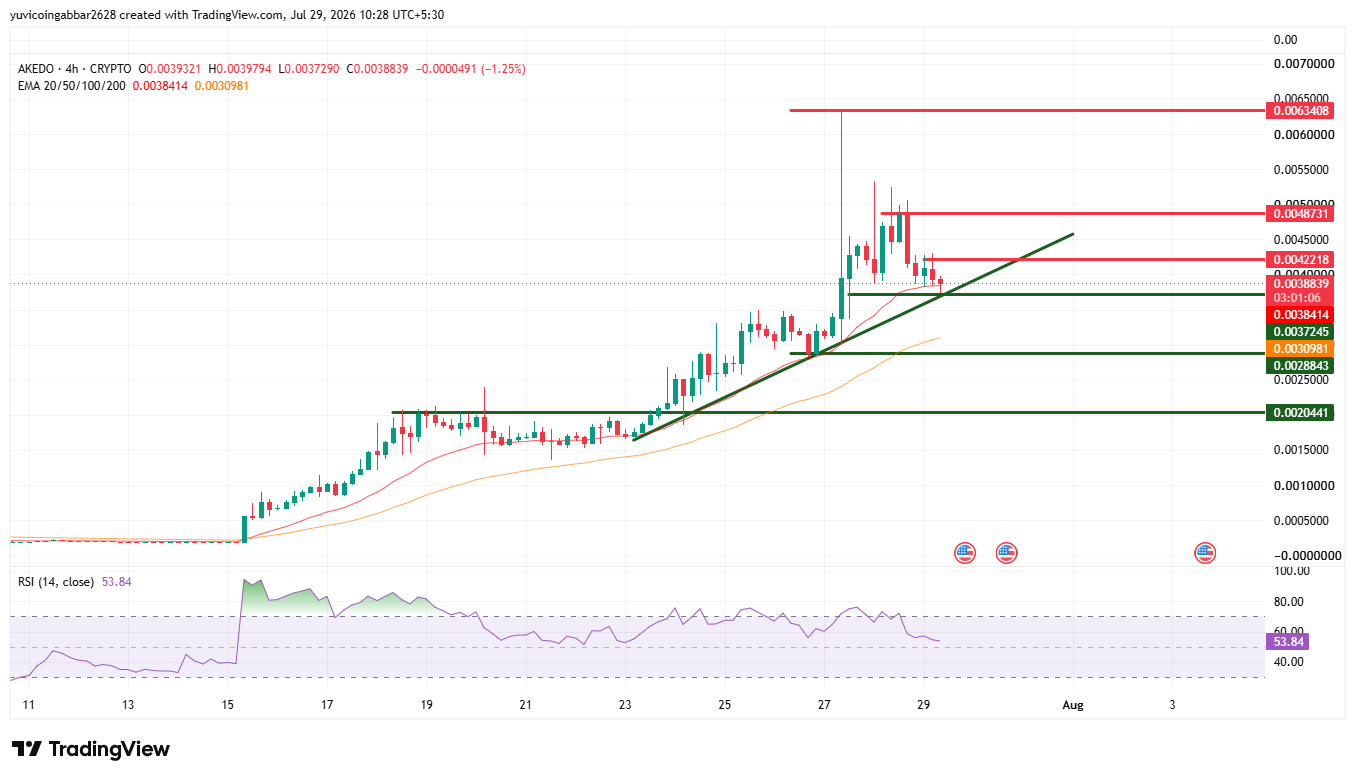
AKE technical analysis: Technical Levels
Level Type | Price | Label |
Resistance 3 | $0.0063408 | Prior high, bull case level |
Resistance 2 | $0.0048731 | Recent supply zone |
Initial Recovery Level | $0.0042218 | EMA/resistance reclaim |
Immediate Price Reference | $0.0038839 | Current price |
First Support | $0.0037245 | Rising trendline |
Deeper Support | $0.0028843 | EMA 50 / support cluster |
Floor Support | $0.0020441 | Breakdown-risk floor |
Bull Case vs. Bear Case
Bull case: If AKE holds the trendline and $0.0037245 support, the path of least resistance is back toward $0.0042218 and then $0.0048731.
A strong reclaim of $0.0048731 with volume would put the July high at $0.0063408 in play as a stretch target.
Bear case: A confirmed close below the trendline and $0.0037245 flips the setup bearish. That would open a slide toward $0.0030981, and a failure there exposes $0.0028843 and the deeper floor at $0.0020441.
Can AKE Reach $0.0063408?
Yes, but only if the trendline holds first. AKE would need to reclaim $0.0042218, then clear $0.0048731 with rising volume, before the July high at $0.0063408 becomes realistic.
Given the 24h Vol/Mkt Cap ratio of 35.58%, there's enough active trading to support a fast move if buyers defend the current zone, but that's conditional on the trendline not breaking in the next few sessions.
What Happens If the Trendline Breaks?
A confirmed break below $0.0037245 would be the clearest bearish signal on this chart.
It would likely trigger a move toward the $0.0030981 support, and if that fails to hold, $0.0028843 and then $0.0020441 become the next reference points.
Given that longs already account for the bulk of recent liquidations, a trendline break could accelerate long-side capitulation.
Expert View
According to CoinGabbar analysts, the setup right now is genuinely balanced: neutral RSI, price sitting exactly on trendline support, and liquidations split close to evenly between longs and shorts.
That's a market waiting for a catalyst rather than one with a clear directional bias. The next few 4H candles closing above or below $0.0037245 will likely tell traders more than any single indicator on this chart.
Disclaimer: This article is for informational purposes only and should not be treated as investment advice. Cryptocurrency markets are highly volatile, and readers should conduct their own research before making any financial decisions.









.jpg)








