Bitcoin Cash Price Prediction: Can Cash 3.0 Push BCH Above $248?


Bitcoin Cash is holding near $212, largely flat over the past day, as attention turns toward the upcoming Cash 3.0 Conference in Cebu City, Philippines.
The official Bitcoin Cash account recently highlighted the August 1 “State of the Bitcoin Cash Mission” talk, bringing ongoing development and real-world $BCH adoption back into focus.
For the Bitcoin Cash Price Prediction, the timing is important as $BCH attempts to stabilize after months of weakness while buyers defend its latest recovery structure.
The event may not move price on its own, but it arrives as $BCH trades near levels that could shape its next move.
BCH Gains 11% in 30 Days: Is the Recovery Strong Enough?
The price action tells a more difficult story than the daily numbers suggest.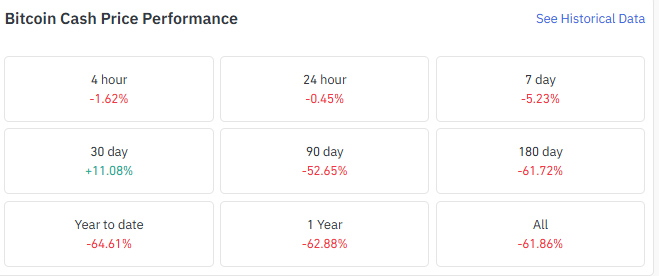
$BCH is up 11.08% over the past 30 days, but that bounce sits inside a much steeper decline down 52.65% over 90 days, 61.72% over six months, and 64.61% year-to-date.
The one-year change of -62.88% underscores that this is still very much a market working through a long drawdown, with the recent short-term strength representing a small recovery rather than a trend reversal.
Daily Chart: Basing Attempt After a Steep Decline → Bitcoin Cash Price Prediction: Can BCH Break $248 or Fall Back Below $198?
The daily chart shows $BCH falling sharply from levels above $400 earlier in the year before flattening out into a rounded consolidation.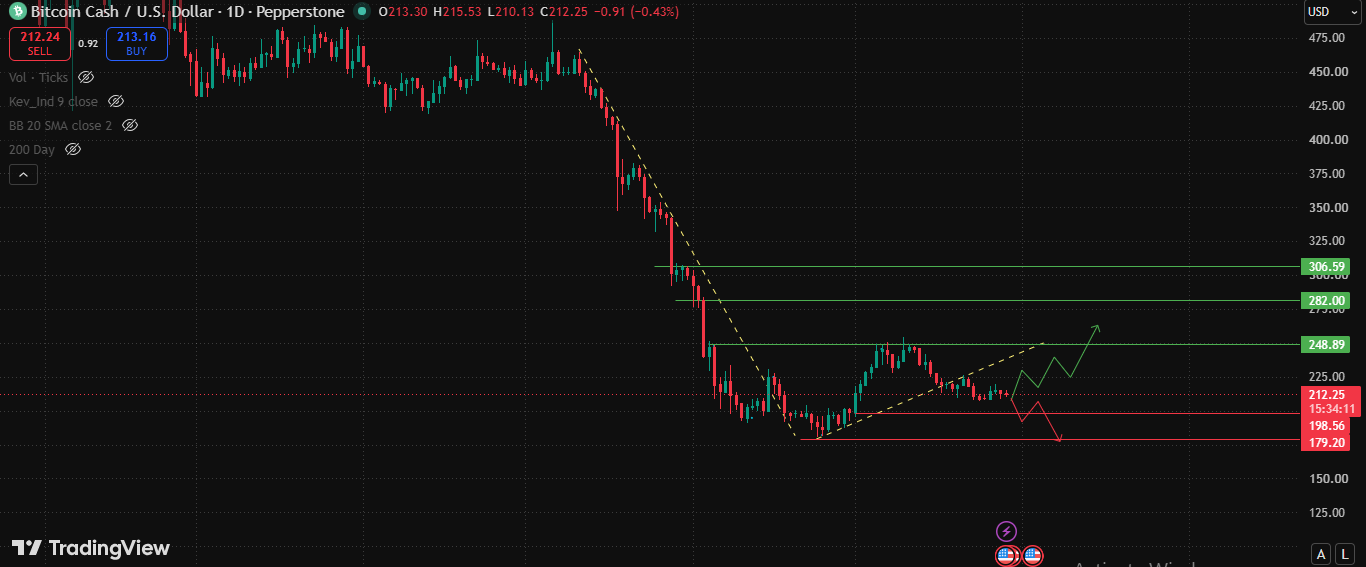
Price has spent recent weeks building a base under a descending trendline, with $212–$213 sitting roughly in the middle of that range.
The nearer-term resistance is $248.89. Clearing it would put $BCH back above the trendline that's capped this consolidation, and from there $282 and $306.59 become the levels that would matter
if momentum genuinely improves though both are further out and depend on follow-through rather than a single move.
On the downside, $198.56 is the level buyers need to defend to keep the base intact.
Losing it would shift focus to $179.20, which lines up closer to the lows this consolidation formed from.
As long as price holds above that zone, the structure still reads as basing rather than breaking down.
Hourly Chart: Short-Term Channel → BCH Holds a Rising Channel, But $214.81 Is the First Test
Zooming into the 1-hour chart, BCH is trading inside a rising channel following a bounce, with price currently around $212.19–$212.24.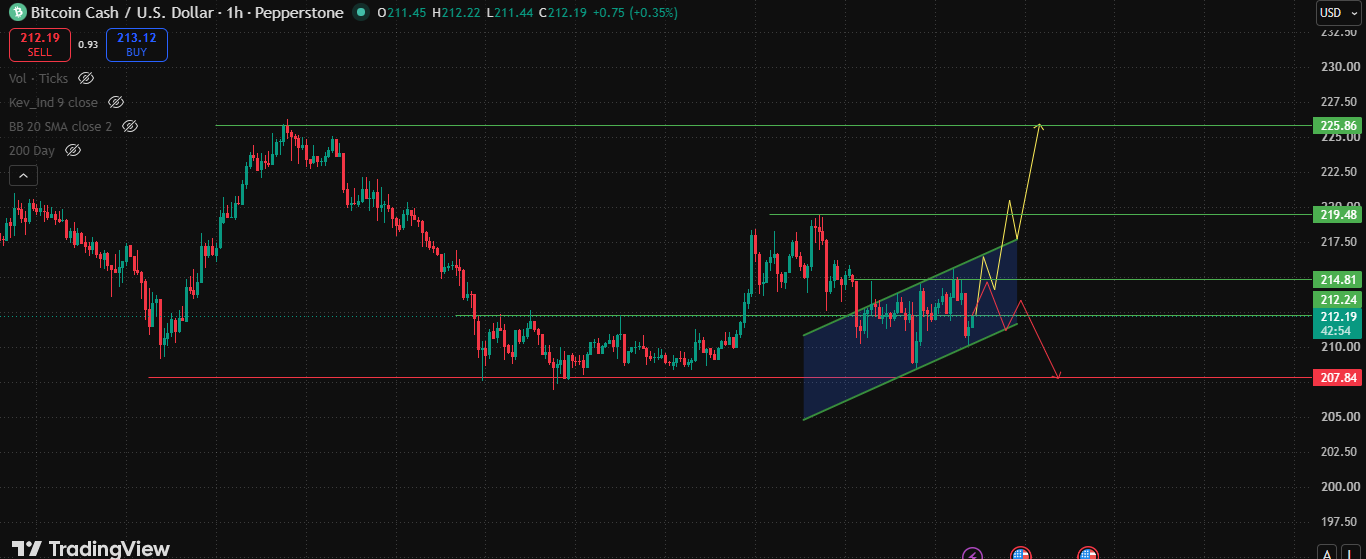
Buyers need to hold this channel and clear $214.81 to keep the short-term structure constructive, with $219.48 and then $225.86 as the next levels if that momentum extends.
If sellers step back in, $212.19 is the immediate line in the sand, and a break below it opens the door to $207.84, which would effectively invalidate the current channel.
Data source: TradingView.com
Derivatives: Leverage Has Come Down, Longs Are Absorbing the Pressure → BCH Traders Lean Long,
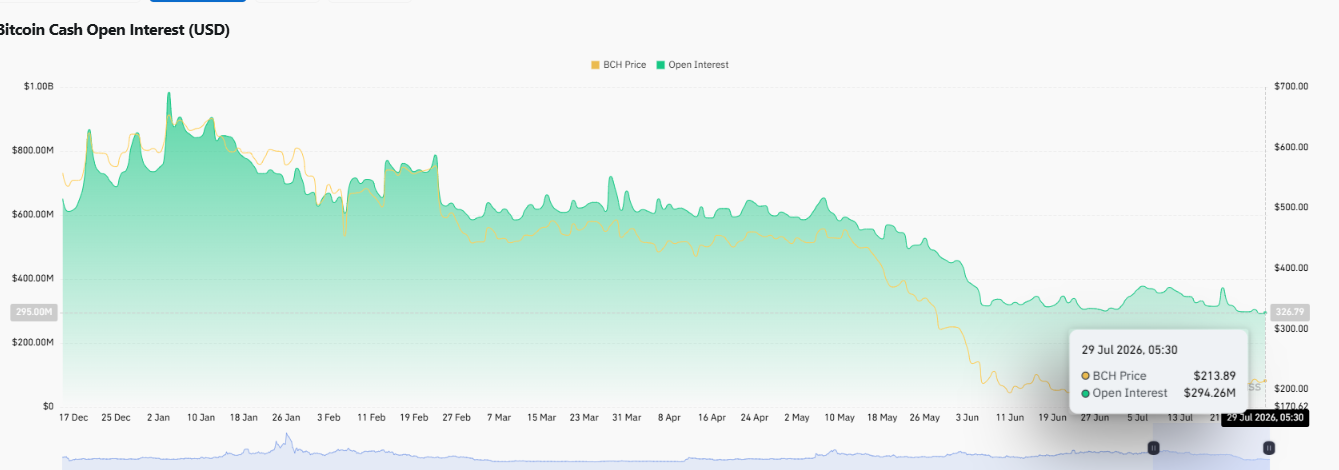
Funding has flattened out to 0.0052%, a notable shift after months of deeply negative funding spikes earlier this year that pointed to aggressive short positioning during the decline.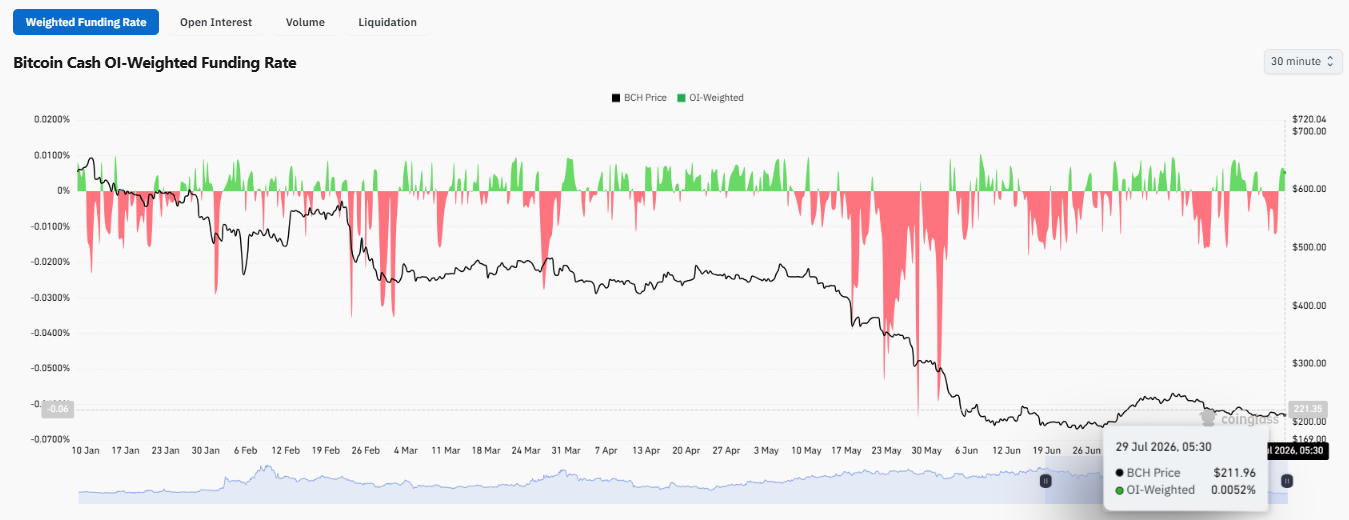 Open interest has fallen alongside price, down to $294.26M from levels well above $800M back in January a sign leverage has been steadily unwound rather than rebuilt into this consolidation.
Long/short ratios lean toward more long accounts on both Binance (1.8129) and OKX (2.23), and Binance's top traders show a similar tilt by account count (2.1857), even though their position-based ratio (0.8526) is more balanced.
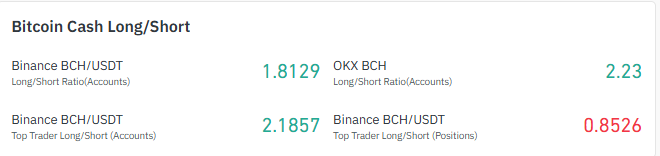 That mismatch, combined with liquidation data showing $224.15K in longs wiped out over 24 hours versus just $8.77K in shorts, suggests longs have been the side taking the pain during recent dips consistent with a market that's cautiously leaning bullish but still getting tested on pullbacks.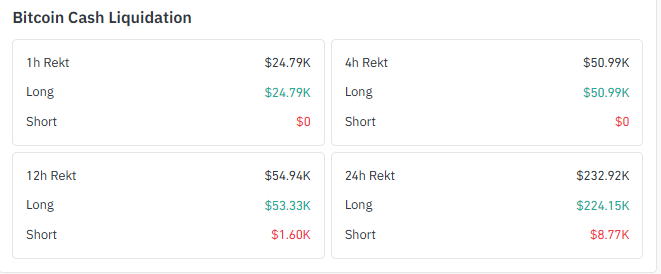
Data source: coinglass.com
Outlook → Can BCH Reach $282, or Is $179 Still at Risk?
As per CoinGabbar's analysis The bullish case for $BCH involves holding the $198.56–$212 zone, reclaiming $214.81 and then $219.48 intraday, and eventually clearing $248.89 on the daily chart to open a path toward $282 and $306.59.
The bearish case starts with a loss of $207.84 short-term, and a deeper break of $198.56 that exposes $179.20. Neither path is confirmed yet.
BCH remains in a consolidation phase where these levels will likely decide the next directional move.
Disclaimer: This article is for informational and educational purposes only and should not be considered financial or investment advice. Cryptocurrency markets are highly volatile, and prices can change rapidly. Readers should conduct their own research (DYOR) and consult a qualified financial advisor before making any investment decisions. The views expressed in this article are based on publicly available information and technical analysis at the time of writing.









.jpg)








