APRZ Trying Trap Sellers: 85.47% in 1 Wallet, ApeMars Price Prediction


APRZ trades at $0.0002866, down 0.80% over 24 hours, but the number that actually matters more than price right now sits in the holder table: a single wallet controls 85.47% of the entire supply.
This ApeMars price prediction covers both sides of that risk: the falling channel APRZ is currently trading in and what happens if the price breaks either direction from here.
APRZ Live Snapshot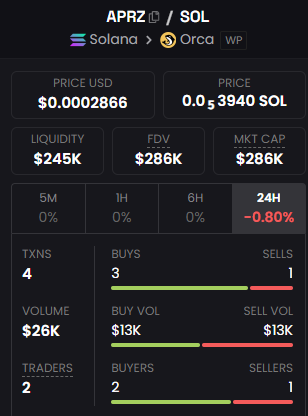
Source: APRZ info by Dexscreener, captured August 7, 2026
Metric | Value |
Price (USD) | $0.0002866 |
Price (SOL) | 0.0005394 SOL |
Market Cap | $286K |
FDV | $286K |
Liquidity | $245K |
24H Change | -0.80% |
24H Volume | $26K |
24H Transactions | 4 (3 buys, 1 sell) |
24H Traders | 2 (2 buyers, 1 seller) |
The Number Behind the "Trap" Framing: Wallet Concentration
Top 5 holders control the vast majority of APRZ's 1B token supply, and the gap between #1 and everyone else is stark: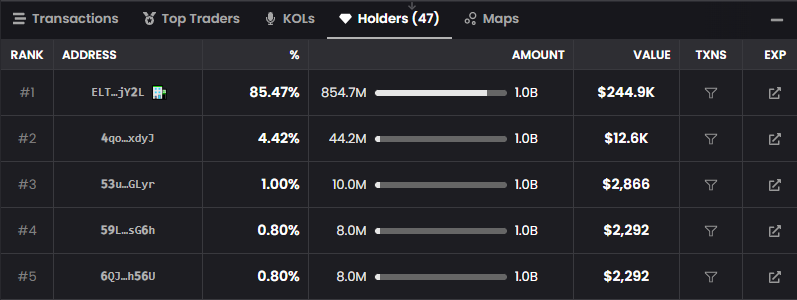
Source: APRZ info by Dexscreener, captured August 7, 2026
With only 47 total holders and just 2 active traders in the last 24 hours, APRZ's liquidity and price action are being driven by an extremely small group.
The single top wallet alone holds more than the next 46 holders combined, several times over.
This is the structural context behind any "sellers trapped" discussion; if that top wallet moves even a fraction of its position, it would dwarf the entire recorded 24-hour volume of $26K.
Chart Structure: The Falling Channel
The market cap chart shows APRZ trading inside a falling channel since early July, lower highs and lower lows both trending downward within two parallel descending trendlines.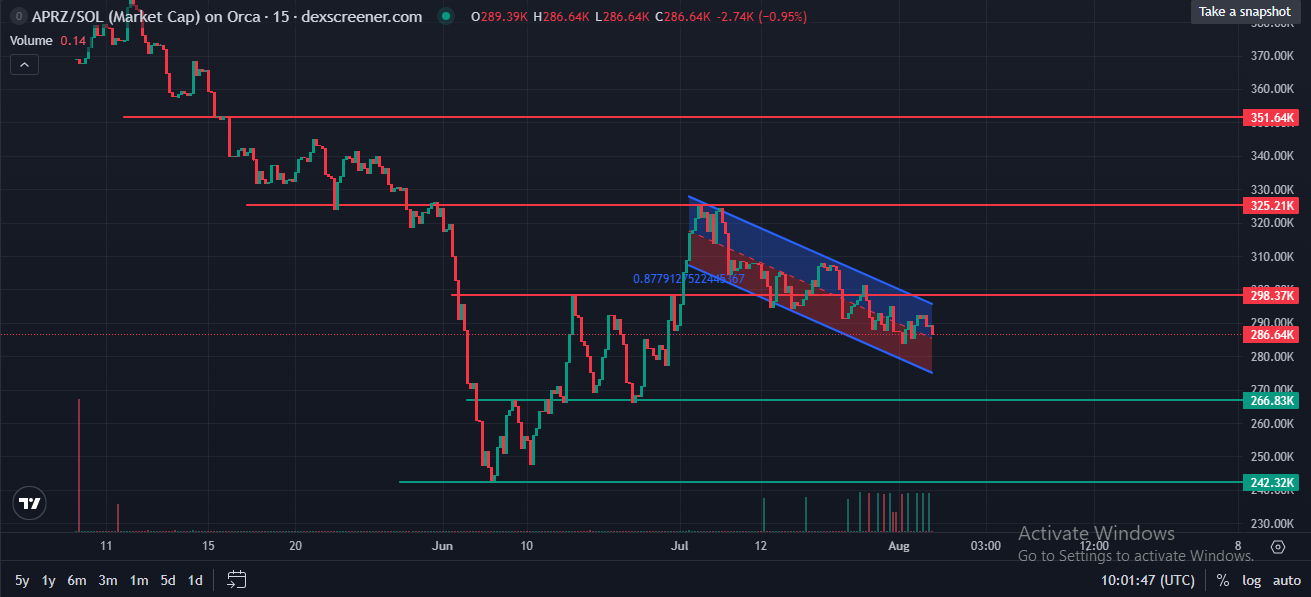
Source: APRRZ Trading Chart by Dexscreener, captured August 7, 2026
Price is currently near the lower boundary of that channel, around the $298.37K resistance-turned-pivot zone, having failed to hold above it on the most recent test.
All Marked Levels on the Chart
Level Type | Market Cap | Approx. Price Equivalent |
Resistance 1 (upper) | $351.64K | ~$0.000352 |
Resistance 2 | $325.21K | ~$0.000325 |
Resistance 3 (nearest) | $298.37K | ~$0.000298 |
Support 1 (nearest) | $266.83K | ~$0.000267 |
Support 2 (lower) | $242.32K | ~$0.000242 |
Current market cap ($286.64K) sits between the nearest resistance ($298.37K) and nearest support ($266.83K), inside the descending channel's lower half.
What Happens on a Downside Break
If APRZ continues its falling-channel trajectory and breaks below the nearer support at $266.83K market cap, the next level is $242.32K.
A confirmed break below both of these levels in sequence would put APRZ into new all-time-low territory, since no further support is marked below $242.32K on the current chart.
Given that only 2 traders were active in the last 24 hours, a break like this could happen on very little actual selling volume.
What Happens on a Reversal
If price instead reverses out of the falling channel to the upside, the setup changes meaningfully.
A confirmed break above the channel's upper trendline and through $298.37K would put pressure on short-term sellers positioned for continued downside, a classic trap-the-sellers dynamic where a reversal forces late shorts or cautious sellers to buy back in, adding fuel to the move.
From there, resistance applies in sequence: $325.21K next, then $351.64K as the outermost marked level.
ApeMars Price Prediction: Bear, Base, and Bull Case
Scenario | Market Cap Target | Approx. Price | Key Drivers |
Bear Case | Break below $242.32K | ~$0.000242 or lower | Falling channel continues, both supports break, new ATL territory, thin volume amplifies moves |
Base Case | $266.83K-$298.37K | ~$0.000267-$0.000298 | Price stays within the channel, no confirmed breakout either direction, extremely low trader count persists |
Bull Case | Break above $298.37K toward $351.64K | ~$0.000298-$0.000352 | Channel reversal, trapped sellers forced to cover, resistance levels break in sequence |
Bear Case: Below $242.32K
If the falling channel holds its current trajectory and both marked supports break, first at $266.83K, then $242.32K, APRZ would move into territory with no further marked support, effectively new all-time-low ground.
This path carries added weight given how few active traders are currently setting prices, meaning even modest selling from outside the top wallet could accelerate a break.
Invalidation: This downside path is invalidated by a sustained hold above $266.83K.
Base Case: $266.83K-$298.37K
The most likely near-term outcome, given the current channel structure and thin trading activity, is continued range-bound movement between the nearest support and resistance.
This assumes neither a decisive breakdown nor a channel reversal, just continued low-conviction price action within the existing descending structure.
Invalidation: a confirmed move outside this range on increased volume signals the base case no longer applies.
Bull Case: Above $298.37K Toward $351.64K
If APRZ reverses out of the falling channel and confirms a break above $298.37K, that move would put pressure on sellers positioned for continued downside, potentially trapping them into buying back as the price climbs toward $325.21K and then $351.64K.
This scenario requires a genuine trend reversal, not just a single green candle, to be considered valid.
Invalidation: This bull case fails if the price rejects at $298.37K and resumes the falling-channel pattern.
Risks Worth Naming Directly
The single largest risk is wallet concentration: one address holds 85.47% of the total supply, and any movement from that wallet, sale, transfer, or otherwise, could overwhelm APRZ's current $245K liquidity and $26K daily volume many times over.
A second risk: only 2 traders were active in the last 24 hours, meaning price levels on this chart are being set by an extremely small group, not broad market consensus.
A third: with just 47 total holders, APRZ remains an early-stage, thinly distributed token where standard technical analysis carries more uncertainty than in more widely held assets.
Glossary
Wallet Concentration: The percentage of total token supply held by a single address; APRZ's top wallet holds 85.47%, a significant centralization risk.
Falling Channel: A technical pattern where price moves downward within two parallel descending trendlines, indicating a sustained but bounded downtrend.
Trapped Sellers: Traders positioned for continued downside who are forced to buy back their position when price unexpectedly reverses higher.
Disclaimer
Informational purposes only, not financial advice. APRZ shows extreme wallet concentration (85.47% in one address) and very low trader activity (2 traders in 24 hours), both of which significantly increase volatility and manipulation risk. Price levels above are read directly from the available market cap chart. Verify all data independently before making any decisions.