ApeMars Price Prediction: Channel Break, Pullback, APRZ Trap or Drop?


By CoinGabbar Crypto Markets Analyst. Reviewed Crypto Markets Editor. Data captured from Dexscreener (APRZ/SOL, Orca) as of July 28, 2026, 10:43 UTC. CoinGabbar has no commercial, affiliate, or paid placement relationship with ApeMars.
Can a chart breakout mean anything when only three traders moved the price in the last 24 hours?
That is the honest question behind this ApeMars price prediction. APRZ has broken out of its recent ascending channel, and on the surface that looks like a bullish signal, but with liquidity this thin, a handful of wallets are effectively deciding the trend.
Table of Contents Key Takeaways APRZ Market Snapshot: Verified Dexscreener Data APRZ Chart Analysis: Channel Structure and Key Levels Why Low Liquidity Changes How This Chart Should Be Read ApeMars Price Prediction: Reading the Channel Breakout What Would Make This Breakout More Credible Expert View: What CoinGabbar Analysts Are Watching Next Glossary Disclaimer FAQs
Key Takeaways
The APRZ trades near $0.0002918 on the APRZ/SOL Orca pool on Solana, down roughly 3.19% over 24 hours.
Liquidity sits at $249K against a $291K market cap and FDV, both figures effectively identical since ApeMars appears to have no meaningful token lockup differentiating circulating from fully diluted supply.
Only 4 transactions and 3 traders were recorded in the past 24 hours, an extremely thin sample that limits how much confidence any single-day chart signal deserves.
The chart shows a confirmed break above the prior ascending channel, but price has since pulled back toward the breakout zone rather than extending higher.
APRZ Market Snapshot: Verified Dexscreener Data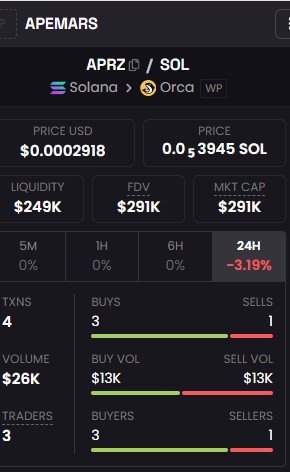
Source: Dexscreener, APRZ/SOL pair on Orca (Solana), captured July 28, 2026, 10:43 UTC
Why Low Liquidity Changes How This Chart Should Be Read
Any credible ApeMars price prediction has to lead with this constraint rather than bury it: a $249K liquidity pool and just 3 traders in 24 hours mean that a single mid-sized order can move APRZ's price meaningfully in either direction.
That does not invalidate the technical structure below, but it does mean the breakout discussed next should be read as a thin-market signal, not confirmation of sustained demand.
A token trading on a single DEX pool with this little daily activity carries materially higher price-manipulation and slippage risk than a token with deeper, multi-venue liquidity.
APRZ Chart Analysis: Channel Structure and Key Levels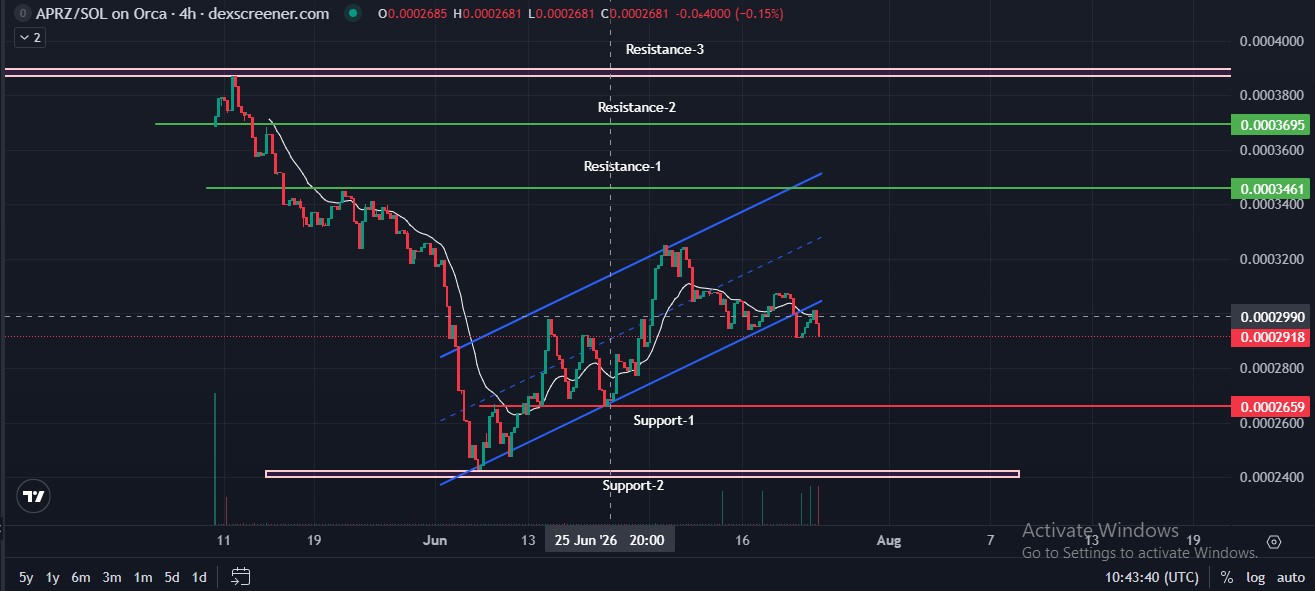
Source: Chart by DexScreener
The 4-hour APRZ/SOL chart on Orca shows a clear ascending channel forming from the token's early-June low, marked by two parallel trendlines: a rising support line connecting successive higher lows, and a rising resistance line tracking the highs above it.
Price pushed to the top of that channel in mid-July, briefly closing above it, which is the "breakout" this article's price prediction section builds on, before pulling back to the $0.0002900 to $0.0003000 zone, where APRZ now trades.
A short-term moving average (the white line running through the candles) had been sloping upward through most of the rally and has now flattened out near the current price, which typically signals the recent uptrend is losing momentum rather than reversing outright.
The horizontal levels marked on the chart give this analysis its key reference points: Resistance-1 at $0.0003461, Resistance-2 at $0.0003695, and Resistance-3 near $0.0004000 sit above the current price, while Support-1 at $0.0002659 and the broader Support-2 zone between $0.0002400 and $0.0002600 sit below it.
The candle pattern over the last several sessions shows shrinking body sizes near the channel's upper boundary
A pattern that often precedes either a consolidation phase or a pullback, rather than an immediate continuation higher, which lines up with the thin-liquidity caution raised elsewhere in this article.
ApeMars Price Prediction: Reading the Channel Breakout
APRZ broke above the ascending channel that had guided its recovery from a prior low, pushing price up before pulling back to the $0.0002900 to $0.0003000 zone it currently occupies.
Bear case: a failure to hold above Support-1 at $0.0002659 would suggest the breakout was a false move, opening a retest of the broader $0.0002400 to $0.0002600 zone marked as Support-2 on the chart.
Base case: price consolidates between Support-1 at $0.0002659 and Resistance-1 at $0.0003461, effectively digesting the breakout without confirming a new trend in either direction.
Bull case: a confirmed, volume-backed close above Resistance-1 at $0.0003461 would open a path toward Resistance-2 at $0.0003695, with Resistance-3 near $0.0004000 as the next technical ceiling if buying pressure sustains beyond that.
Invalidation trigger: the bull case is invalidated by a sustained close back below $0.0002659. The bear case is invalidated by a clean, volume-supported hold above $0.0003461 for more than one trading session.
What Would Make This Breakout More Credible
Given only 4 transactions occurred in the last 24 hours, the single clearest signal to watch next is whether daily transaction count and unique trader count both increase alongside price, not price movement alone.
A breakout on rising volume from a broader set of wallets is meaningfully more reliable than the same price move driven by 3 traders, since the latter could reverse just as quickly as it formed.
Until Dexscreener shows sustained double-digit daily transactions and liquidity meaningfully above the current $249K, treat any single-day chart pattern on APRZ as provisional.
Expert View: What CoinGabbar Analysts Are Watching Next
CoinGabbar analysts note that ApeMars currently trades exclusively through the APRZ/SOL pool on Orca, a single-DEX, single-chain listing that concentrates all of its liquidity risk in one venue.
That structure means a broader exchange listing, even a mid-tier one, would materially change the risk profile discussed above by spreading trading activity and reducing the outsized influence any single wallet currently holds. No such listing has been confirmed as of this writing.
Analysts recommend treating the breakout and pullback pattern on the current chart as informative but provisional and watching daily transaction counts on Dexscreener, not just price, as the more reliable early signal of whether this move has real support behind it.
Glossary
-
Liquidity Pool: The pooled funds on a decentralized exchange that enable trading of a token pair, here APRZ against SOL.
-
FDV (Fully Diluted Valuation): Total token supply multiplied by current price, including any tokens not yet in circulation.
-
Bull Trap: A price move that appears to signal a breakout but reverses shortly after, trapping buyers who entered expecting continuation.
-
Support/Resistance: Price levels where historical buying or selling activity has previously slowed or reversed a trend.
Disclaimer
This article is for informational purposes only, not financial advice. All price levels and scenarios are analyst estimates, not guarantees. APRZ trades with very low liquidity and daily volume, which increases volatility and slippage risk. Cryptocurrency carries significant risk of loss. Verify all data through Dexscreener and official ApeMars channels before deciding.