ApeMars Price Prediction: Rising Channel Fails, $0.00026 or Rebound?


By Crypto Markets Analyst. Reviewed by Crypto Markets Editor. Data captured from Dexscreener (APRZ/SOL, Orca) as of July 29, 2026, 09:13 UTC.
When a rising trendline that held for weeks finally breaks, does the chart actually confirm a reversal, or is it too early to call it anything more than a pause?
That is the specific question behind this ApeMars price prediction, and it's a different question than asking whether a breakout will hold; this time the structure that's failing is the support side, not the resistance side.
APRZ's 4-hour chart shows price has slipped below the rising channel that had guided its recovery since June, and the moving average line that had been sloping upward through most of that move has now rolled over and turned down with it.
Table of Contents
-
Key Takeaways
-
APRZ Market Snapshot: Verified Dexscreener Data
-
Chart Analysis: Why This Channel Failure Differs From a Normal Pullback
-
Distance to Key Levels: A Quick-Reference Table
-
ApeMars Price Prediction: $0.00026 Breakdown vs. Rebound
-
Why Low Liquidity Still Matters Here
-
Expert View: What Would Actually Confirm the Rebound Case
-
Glossary
-
Disclaimer
-
FAQs
Key Takeaways
APRZ trades near $0.0002929, up a modest 0.69% over the last 4-hour candle, after slipping below its recent rising channel.
Support-1 at $0.0002659 is the immediate level in focus; a confirmed break below it would put APRZ into the broader $0.0002400 to $0.0002600 Support-2 zone.
The chart's short-term moving average, which had sloped upward through the June-July rally, has now turned downward, a distinct signal from the flattening pattern seen in APRZ's prior breakout attempt.
Resistance-1 at $0.0003461 and Resistance-2 at $0.0003695 remain the levels a rebound would need to reclaim to invalidate the current bearish structure.
ApeMars Market Snapshot
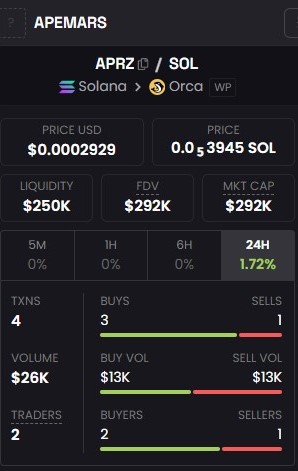
Source: Dexscreener, APRZ/SOL pair on Orca (Solana), captured July 29, 2026, 09:13 UTC
Chart Analysis: Why the Channel Breakdown Matters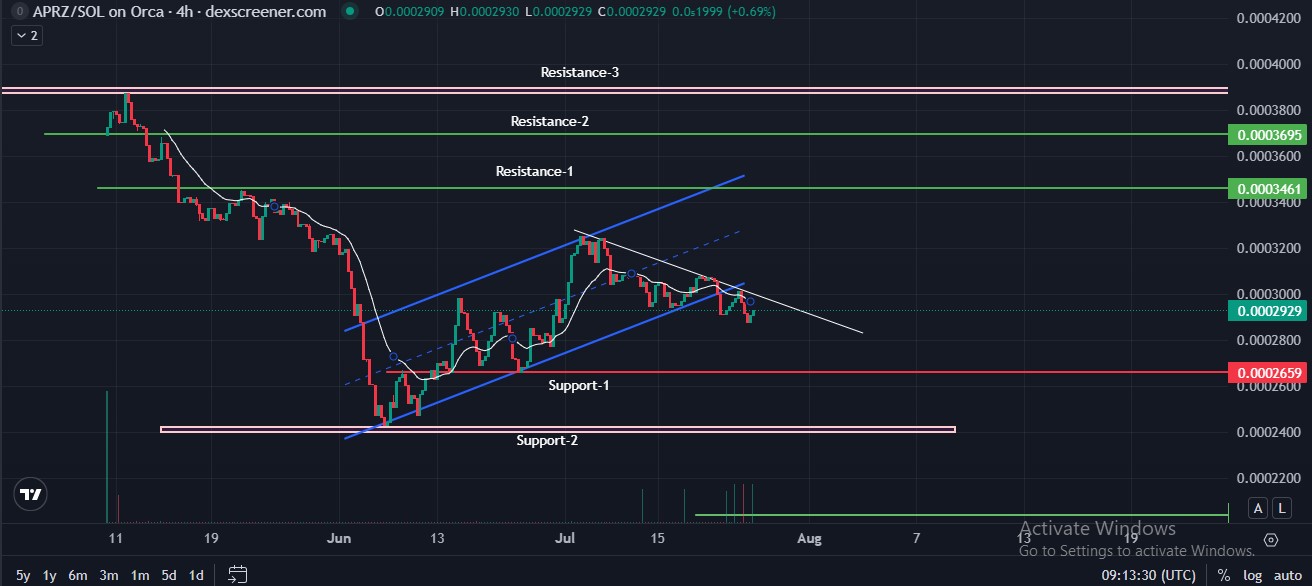
Source: ApeMars Chart by DexScreener
This is the piece of the APRZ price prediction picture that a simple price snapshot misses: APRZ is not just trading lower; it has broken the structural trendline that defined its entire recovery move.
The rising channel connected a series of higher lows from early June through mid-July, while its upper boundary marked successive swing highs.
Moving Average Confirms a Shift in Trend
The ApeMars price pushed toward the top of the channel in mid-July before rolling over and closing below the lower trendline.
That is more significant than a normal pullback because it breaks the pattern of higher lows that supported the uptrend.
The moving average also curved upward during the rally, flattened near the recent peak, and has now turned downward alongside price.
This does not guarantee further downside, but the setup now requires a stronger reversal signal to invalidate the bearish channel-break scenario.
Distance to Key Levels: A Quick-Reference Table
Framing each chart level as a percentage move from current price makes it easier to gauge which scenario requires the smaller move, useful context that a support/resistance list alone doesn't provide.
Support-1 sits notably closer to the current price than Resistance-1, meaning the bearish scenario below requires a smaller move to trigger than the bullish one does at this exact moment.
ApeMars Price Prediction: $0.00026 Breakdown vs. Rebound
With the rising channel already broken, the more probable near-term path favors testing $0.0002659 before any move back toward resistance, given the closer distance and the moving average's downward turn.
A bearish scenario has APRZ closing below Support-1 at $0.0002659, which would open a retest of the broader $0.0002400 to $0.0002600 Support-2 zone, roughly 18% below current price.
A base scenario has APRZ holding above Support-1 but failing to reclaim the broken channel, chopping sideways in a $0.0002600 to $0.0003000 range while the market digests the trendline failure.
A rebound scenario requires a volume-backed close back above Resistance-1 at $0.0003461, which would meaningfully undercut the bearish structural read above and open a path toward Resistance-2 at $0.0003695.
Invalidation triggers: the rebound scenario is invalidated by a sustained close below $0.0002659.
The bearish scenario is invalidated by a clean, volume-supported close back above $0.0003461 for more than one session, which would represent APRZ reclaiming the broken channel entirely.
Why Low Liquidity Still Matters Here
Every level discussed above should be read through APRZ's thin trading conditions on its single Orca liquidity pool.
A market with low daily transaction counts and a limited trader base can produce sharp moves through key levels on relatively small order sizes, meaning both the breakdown and rebound scenarios could trigger, then reverse, faster than they would on a deeper, multi-venue market.
This is a persistent structural feature of trading APRZ right now, not something specific to this particular channel failure, and it applies equally whether the price is testing support or resistance.
Expert View: What Would Actually Confirm the Rebound Case
CoinGabbar analysts note that a broken rising channel with a rolling-over moving average is a meaningfully different technical picture than the breakout-then-pullback pattern APRZ showed in its prior chart update, and treating the two as the same setup would understate the shift in structure.
The single clearest signal that would tilt this ApeMars price prediction back toward the rebound case is the moving average flattening and turning back upward while price holds above Support-1, rather than price alone bouncing on thin volume.
Analysts recommend watching for that moving-average shift specifically over the next several sessions, alongside any increase in daily transaction count, as more reliable rebound evidence than a single green candle near $0.0002659.
Glossary
-
Rising Channel: A technical pattern formed by two parallel upward-sloping trendlines connecting a series of higher highs and higher lows.
-
Moving Average: A trend-following indicator that smooths price data, useful for identifying whether a trend is strengthening, flattening, or reversing.
-
Support/Resistance: Price levels where historical buying or selling activity has previously slowed or reversed a trend.
-
Channel Failure: A break below a rising channel's lower trendline, distinct from a routine pullback that stays within the channel.
Disclaimer
This article is for informational purposes only, not financial advice. All price levels and scenarios are analyst estimates, not guarantees. APRZ trades with low liquidity and thin daily volume, which increases volatility and slippage risk. Cryptocurrency carries significant risk of loss. Verify all data through Dexscreener and official ApeMars channels before deciding.









.jpg)








