ApeMars Price Prediction 2026: Can $APRZ Become the Biggest Meme Coin?


By Crypto Markets Analyst. Reviewed by the Crypto Markets Editor. Data captured from Dexscreener (APRZ/SOL, Orca) as of July 30, 2026.
Can a token trading on a single Solana liquidity pool, with just 2 unique traders in the last 24 hours, meaningfully be discussed in the same sentence as Dogecoin or Shiba Inu?
That's the honest framing this ApeMars Price Prediction 2026 needs before anything else.
$APRZ has also just broken down from the rising channel that defined its June-July recovery, and price is now tracking a new descending trendline rather than climbing back toward it, a technical detail that matters as much to this outlook as the "biggest meme coin" question does.
Table of Contents
-
Key Takeaways
-
APRZ Market Snapshot: Verified Dexscreener Data
-
Chart Analysis: Channel Breakdown and the New Descending Trendline
-
ApeMars Price Prediction 2026: Bear, Base, and Bull Scenarios
-
Can APRZ Become the Biggest Meme Coin? A Market Cap Reality Check
-
What APRZ Would Actually Need to Grow
-
Why Low Liquidity Still Shapes Every Level on This Chart
-
Expert View: Separating the Chart Setup From the Meme-Coin Ambition
-
Glossary
-
Disclaimer
-
FAQs
Key Takeaways
APRZ trades at $0.0002877, down 0.66% over the last 4-hour candle, with a $287K market cap and FDV, both effectively identical since ApeMars shows no meaningful lockup differentiating circulating from fully diluted supply.
Liquidity sits at $245K against just 3 transactions and 2 unique traders in the past 24 hours, an extremely thin sample for any technical signal.
The chart confirms $APRZ broke down from its prior rising channel and is now tracking a new descending trendline connecting recent lower highs.
The global meme coin sector is worth roughly $34.7 billion as of July 2026; $APRZ's $287K market cap represents about 0.0008% of that total.
APRZ Market Snapshot: Verified Dexscreener Data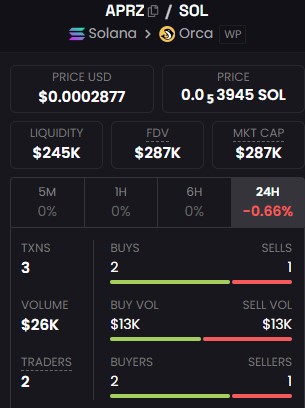
Source: Dexscreener, APRZ/SOL pair on Orca (Solana), captured July 30, 2026, 08:40 UTC
Chart Analysis: Channel Breakdown and Trend Shift
The 4-hour APRZ/SOL chart shows a clear sequence: price rallied inside a rising channel, marked by two parallel upward-sloping trendlines, from early June through mid-July, then broke down below the channel's lower boundary.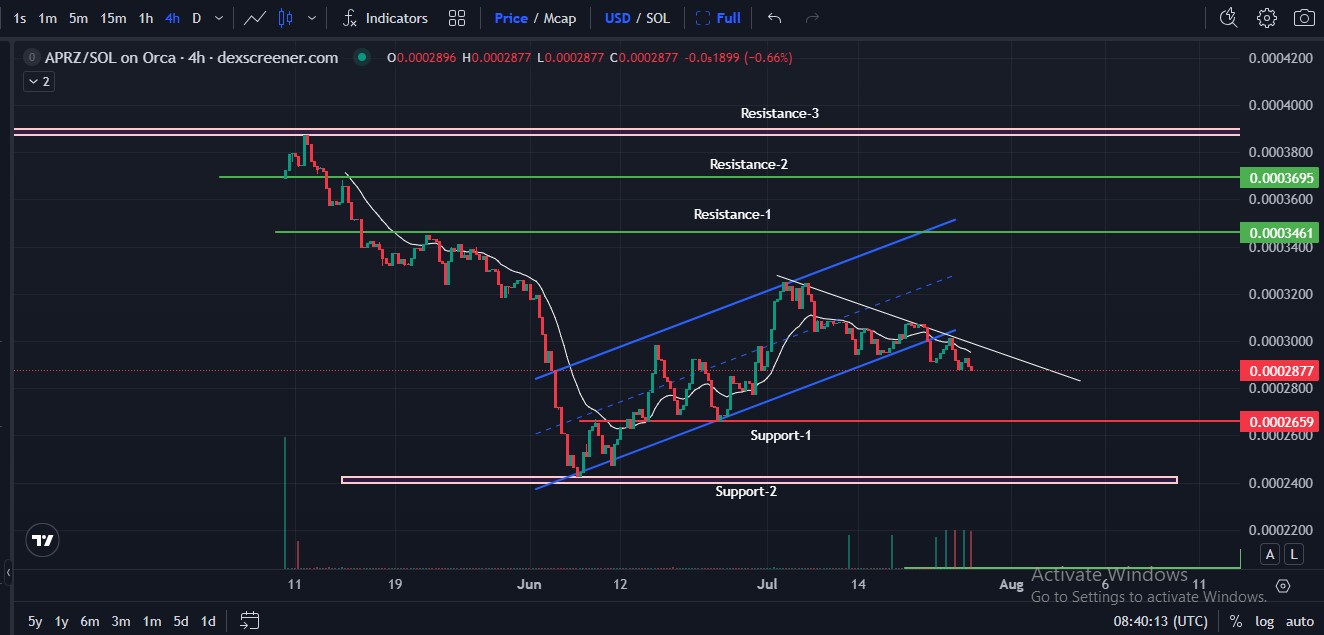
Source: ApeMars 4-hour APRZ/SOL chart by DexScreener
That breakdown is the key structural event shaping this ApeMars Price Prediction 2026, since it converts what had been a recovery pattern into something more uncertain.
Since the breakdown, price hasn't simply drifted; it's tracking a distinct new descending trendline, visible as the white downward-sloping line connecting the recent lower highs from mid-July onward.
APRZ Tests the New Descending Trendline
The APRZ is currently trading right along that descending trendline near $0.0002877, which means the immediate technical question is not just about horizontal support and resistance; it's whether price can close back above this descending trendline at all before testing the horizontal levels below.
The horizontal levels on the chart remain unchanged from the prior channel structure: Resistance-1 at $0.0003461, Resistance-2 at $0.0003695, and Resistance-3 near $0.0004000 sit well above current price, while Support-1 at $0.0002659 and the broader Support-2 zone near $0.0002400 sit below it.
Because price is now below both the descending trendline and the old channel's lower boundary, reclaiming either one, the descending trendline first, then the broken channel support, would be the two sequential signals needed before this ApeMars Price Prediction could reasonably shift back toward the bullish scenarios below.
ApeMars Price Prediction 2026: Bear, Base, and Bull Scenarios
Direct answer: with $APRZ tracking a fresh descending trendline below its broken channel, the near-term technical bias favors continued downside testing before any reversal, though a low-liquidity market like this can shift quickly on very little volume.
A bear scenario has $APRZ closing below Support-1 at $0.0002659, opening a retest of the broader $0.0002400 Support-2 zone, roughly 17% below current price.
A base scenario has it consolidating between Support-1 and the descending trendline, effectively going sideways while the market digests the channel breakdown without confirming a new direction.
A bull scenario requires it to close back above the descending trendline first, then reclaim Resistance-1 at $0.0003461 on rising volume, a considerably higher bar now than it would have been before the channel broke, since it requires overturning two separate technical failures rather than one.
Invalidation triggers: the bull scenario is invalidated by a sustained close below $0.0002659. The bear scenario is invalidated by a volume-backed close back above the descending trendline followed by a hold above $0.0003461 for more than one session.
Can APRZ Become the Biggest Meme Coin? A Market Cap Reality Check
This is the specific question this ApeMars Price Prediction 2026 needs to answer honestly with real numbers, not aspiration.
Benchmarking $APRZ against the meme coins it would need to overtake makes the scale of the gap concrete.
For $APRZ to become "the biggest meme coin," it wouldn't need to double or 10x, it would need to grow roughly 70,000-fold from current levels just to match Dogecoin's current market cap, a scale of growth with no realistic historical precedent for a token at this liquidity stage.
Even matching PEPE's smaller $1.9 billion valuation would require it to grow around 6,600 times its current size.
These figures are illustrative benchmarks based on current 2026 market data, not a scored prediction that it will reach any of them.
What APRZ Would Actually Need to Grow
Given that gap, the more realistic 2026 ApeMars Price Prediction question is what it would need to become a credible small-cap contender at all, not the biggest meme coin outright.
Three things matter more than price action alone: liquidity growing well beyond the current $245K pool to support larger trades without extreme slippage, daily transaction and trader counts moving from single digits into the hundreds or thousands
Ideally, a listing beyond its single Orca liquidity pool to reduce concentration risk in one venue.
None of these are currently confirmed as in progress; they represent the baseline conditions a token like $APRZ would need before any comparison to established meme coins becomes meaningful.
Why Low Liquidity Still Shapes Every Level on This Chart
Every support, resistance, and trendline level discussed above should be read through $APRZ's current liquidity constraints.
A $245K pool with only 2 unique traders in 24 hours means a single mid-sized order can move price through several of these levels in one transaction, which is a meaningfully different risk profile than the levels would carry on a deeper, multi-venue market.
This does not invalidate the technical structure, but it does mean any single-day breakout or breakdown deserves confirmation from rising transaction counts before being treated as a reliable trend signal.
Expert View: Separating the Chart Setup From the Meme-Coin Ambition
CoinGabbar analysts note that ApeMars faces two entirely separate challenges that should not be conflated into one narrative.
The near-term technical setup, a broken rising channel now tracking a descending trendline, is a standard, analyzable chart pattern with clear levels to watch.
The longer-term "biggest meme coin" ambition referenced in ApeMars' own community discussion is a different order of magnitude entirely, requiring growth on a scale with few historical parallels among tokens that started with this little liquidity.
Analysts recommend treating the chart-level analysis above as the actionable near-term read and treating any "biggest meme coin" framing as a long-horizon aspiration that current trading data does not yet support.
Glossary
-
Rising Channel: A technical pattern formed by two parallel upward-sloping trendlines connecting a series of higher highs and higher lows.
-
Descending Trendline: A line connecting a series of lower highs, indicating a market currently under selling pressure until it's broken.
-
FDV (Fully Diluted Valuation): Total token supply multiplied by current price, including any tokens not yet in circulation.
-
Support/Resistance: Price levels where historical buying or selling activity has previously slowed or reversed a trend.
Disclaimer
This article is for informational purposes only, not financial advice. All ApeMars Price Prediction 2026 figures and scenarios are analyst estimates, not guarantees. APRZ trades with very low liquidity and daily volume, which increases volatility and slippage risk. Meme coin market cap comparisons are illustrative benchmarks using approximate July 2026 figures and are not a forecast that APRZ will reach any listed valuation. Cryptocurrency carries a significant risk of loss. Verify all data through Dexscreener and official ApeMars channels before deciding.









.jpg)








