ApeMars Price Prediction: Why Are Buyers Weak? Is $APRZ Listing Near?


Why does a chart keep bouncing off the same ceiling instead of breaking through it? That's the pattern currently shaping every ApeMars price prediction discussion.
APRZ has clawed back some ground from its recent lows, yet each attempt to push higher keeps stalling in the same tight zone, and the volume behind those attempts looks thinner than the price action alone would suggest.
With the token still trading well under its official listing price, buyers appear more cautious than convinced right now, which raises the real question this piece digs into: Is weak demand simply a phase, or is it telling us something more important about where APRZ goes next?
ApeMars Listing Price: The Gap Buyers Are Watching
The official ApeMars site currently shows the project status as "Live" with a confirmed debut price of $0.0005.
Against today's $0.0003170 trading price, that puts APRZ roughly 37% below its own official listing benchmark, a gap that continues to function as a long-term psychological target for holders who bought during the presale.
It's worth noting that $APRZ presale marketing at various stages referenced a much higher promotional launch figure earlier in the campaign, but the figure currently confirmed on the official site and used as the live benchmark is $0.0005.
Every move APRZ makes back toward that number matters more to sentiment than any single resistance test, since it represents the point where the broader market officially agrees with the project's own stated valuation.
Source: ApeMars official website
| Confirmed | Unconfirmed / Speculative |
|---|---|
| Current price: $0.0003170; official listing price: $0.0005. | Timing of any centralized exchange (CEX) listing. |
| Resistance and support levels are visible on the Orca price chart. | Whether Resistance-2 holds or breaks on the next attempt. |
| 63% APY staking with a two-month post-launch lock. | Sustained daily trading volume needed to confirm a genuine breakout. |
APRZ Buyers: Why Momentum Keeps Stalling
The weak-buyer story behind every recent ApeMars price prediction comes down to one recurring issue: volume isn't confirming the price recovery.
APRZ has managed to reclaim ground from deeper lows and hold above Support-1, which is a genuinely constructive technical sign, but each push toward resistance has lacked the sustained buying pressure needed to convert a bounce into a breakout.
This pattern, price recovering while volume stays thin, typically means existing holders are defending their positions rather than new buyers actively entering.
Until daily activity expands meaningfully beyond current levels, each test of Resistance-1 or Resistance-2 should be treated as a potential reversal point rather than confirmation that a real trend change is underway.
ApeMars Price Prediction: Reading the Current Chart
The current APRZ/SOL chart on Orca shows the token trading at $0.0003170, down 0.97% in the session, with the 20-period EMA sitting at $0.0003116 just below the current price, meaning short-term momentum has only barely turned positive.
Zooming out, the chart maps out a clear structure: Resistance-2 sits near $0.0003400, Resistance-1 sits near $0.0003000, Support-1 sits near $0.0002600, and Support-2 sits near $0.0002400.
Price is currently caught between the EMA and resistance-2, a compression zone that has produced repeated small rejections rather than a clean breakout.
For any $APRZ price prediction built on technicals alone, this is the exact zone where buyer conviction is being tested right now.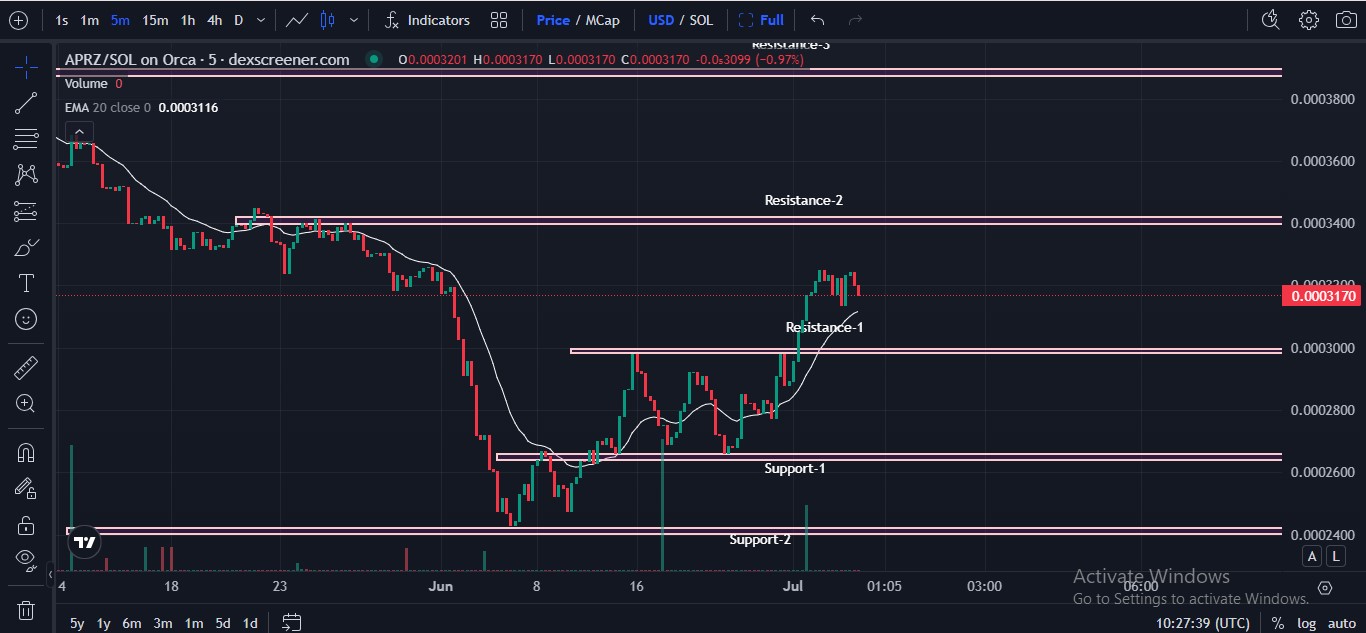
Source: Chart by DexScreener
| APRZ Chart Snapshot | Value |
|---|---|
| Current Price | $0.0003170 |
| Session Change | -0.97% |
| EMA 20 (Close) | $0.0003116 |
| Resistance-2 | ~$0.0003400 |
| Resistance-1 | ~$0.0003000 |
| Support-1 | ~$0.0002600 |
| Support-2 | ~$0.0002400 |
ApeMars Listing Catalyst: Could a CEX Debut Change the Picture
Beyond the chart, the biggest open question for any ApeMars price prediction is whether a centralized exchange listing could function as the catalyst weak buyer demand hasn't provided organically.
APRZ currently trades through decentralized venues, giving it real but limited liquidity and discoverability compared to a CEX listing.
A confirmed centralized debut would likely widen the buyer base considerably beyond the current presale era holder group, which has so far been the primary source of both support and resistance in the current range.
No such listing has been officially confirmed at this stage, so this remains a scenario to watch rather than a near-term certainty.
Until then, the same technical range is likely to keep defining APRZ price prediction outlooks.
Expert View: ApeMars Price Prediction and What Comes Next
Coingabbar analysts tracking ApeMars note that reclaiming ground above Support-1 while staying below the EMA-20 and Resistance-2 puts APRZ in a genuine "prove it" zone; the structure has improved, but conviction hasn't yet followed.
A sustained close above Resistance-2 with volume clearly above recent averages would be the strongest signal the recovery is real rather than a dead-cat bounce.
For verified project updates, including any future CEX listing news, the official ApeMars website and its X account remain the most reliable sources, since third-party promotional coverage has occasionally cited different listing-price figures than what the project's own site currently confirms.
Disclaimer
This article is for informational purposes only and does not constitute financial or investment advice. All ApeMars price prediction figures, resistance and support levels, and listing speculation mentioned are based on publicly available chart data and project statements and are not guaranteed outcomes. No official CEX listing has been confirmed at the time of writing. Cryptocurrency investments carry significant risk, including potential loss of capital. Always do your own research and verify information through official channels.












.webp)




