FLOKI Price Prediction 2027: Is Viking Coin Loading Its Next Big Move?


FLOKI has been trading quietly for weeks now, and while most people stopped paying attention, the chart has been building something worth a second look.
There's a lot of chatter online about FLOKI price prediction 2027, and honestly, the setup right now backs some of that talk up. Price is squeezed into a tight range on the lower timeframes, and there's a bigger trendline on the daily chart that just won't give up.
It feels like FLOKI is sitting at a fork in the road. One side leads to another leg; down the other side opens up a much bigger move heading into 2027.
Liquidation Data: Both Sides Are Getting Squeezed
Recent liquidation numbers tell their own story too. Both longs and shorts have been getting flushed out as the price whips back and forth inside this tight range. 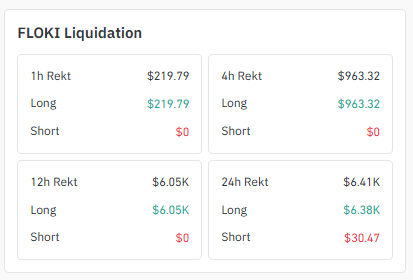
Source: Data Taken From Coinglass
That kind of two-sided pain usually shows up right before a market finally commits to a direction. When liquidations keep stacking up on both sides like this, it's often a sign the market is shaking out weak hands.
Before the next real move, and the traders who position early tend to be the ones who benefit most once it happens.
Volume Heatmap: Exchanges Are Buzzing Around FLOKI
Trading activity around FLOKI has picked up across several major exchanges, and that's usually a sign traders haven't written this coin off despite the choppy price action lately. 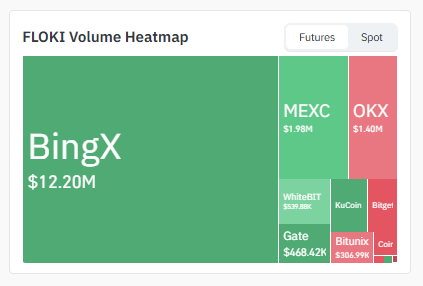
Source: Data Taken From TradingView
Spread-out volume like this across multiple platforms often means FLOKI is back on people's radar, and that kind of attention tends to show up right before price makes a real decision.
The 4H Chart: FLOKI Is Trapped Inside a Descending Channel
Pull up the 4-hour chart and you'll see FLOKI stuck inside a clean descending channel. Lower highs, lower lows, bouncing between two sloped lines like it's stuck in a funnel. Structures like this don't stay put forever, though.
At some point price has to choose a direction, and once it does, it usually moves fast. 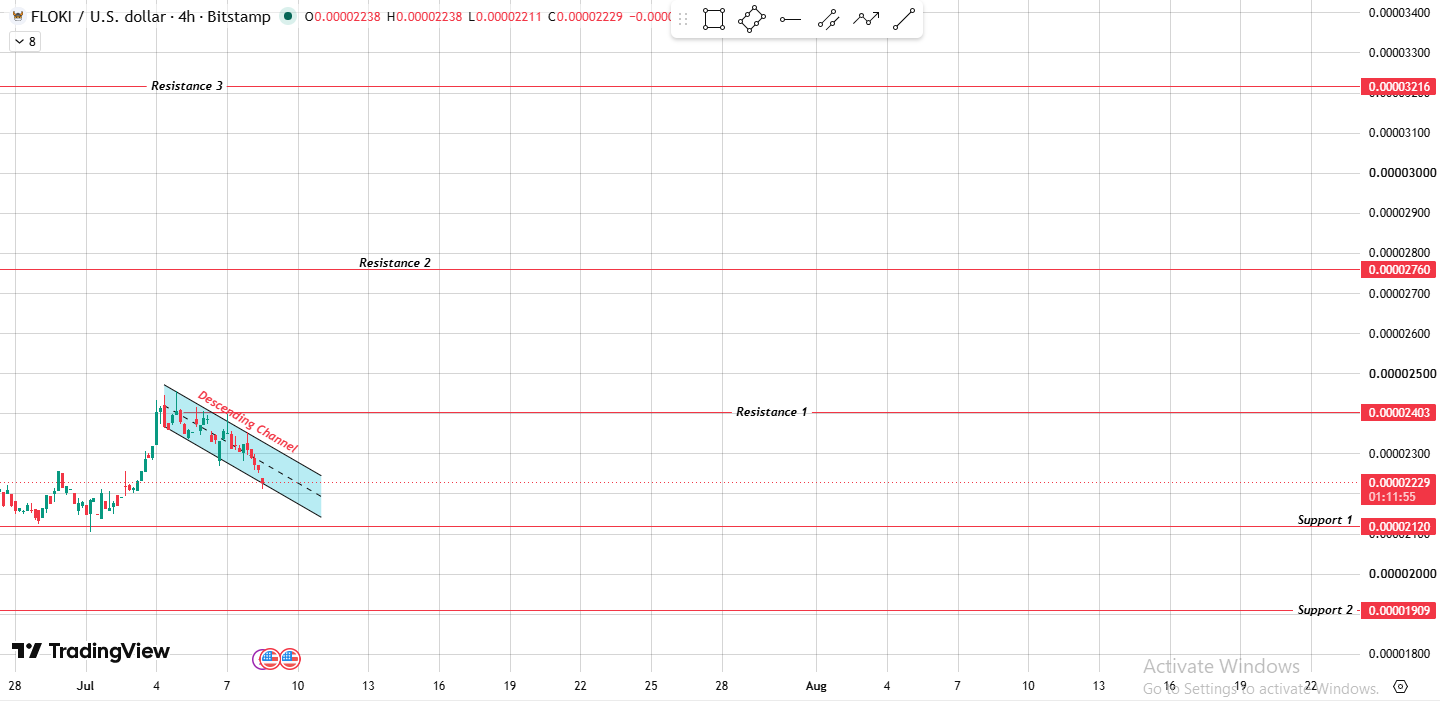
Source: Chart Taken By TradingView
If buyers manage to push through the top of this channel with some real strength behind it, FLOKI could head straight toward the resistance zones sitting above, levels that have been capping every rally attempt for weeks.
Breaks like this tend to move quicker than people expect too, mostly because a lot of short positions get caught off guard and forced to cover.
If the bottom of the channel breaks instead, that's the market telling you sellers still have control. It wouldn't just be a small pullback either.
Losing that floor would confirm the bears are running the show for now.
Whichever way it goes, this channel is the thing to watch right now. It's probably going to decide how the next few days play out.
4H Key Levels:
| Level | Price (USD) |
|---|---|
| Resistance 3 | 0.00003216 |
| Resistance 2 | 0.00002760 |
| Resistance 1 | 0.00002403 |
| Current Price | 0.00002229 |
| Support 1 | 0.00002120 |
| Support 2 | 0.00001909 |
The 1D Chart: The Falling Wedge That's Deciding FLOKI's Fate
Zoom out to the daily chart, and the story changes a bit, and this is really the one that matters more for anyone thinking beyond the next few days.
FLOKI Price Prediction 2027 has been running into the same descending trendline over and over, getting rejected almost every single time it gets close. 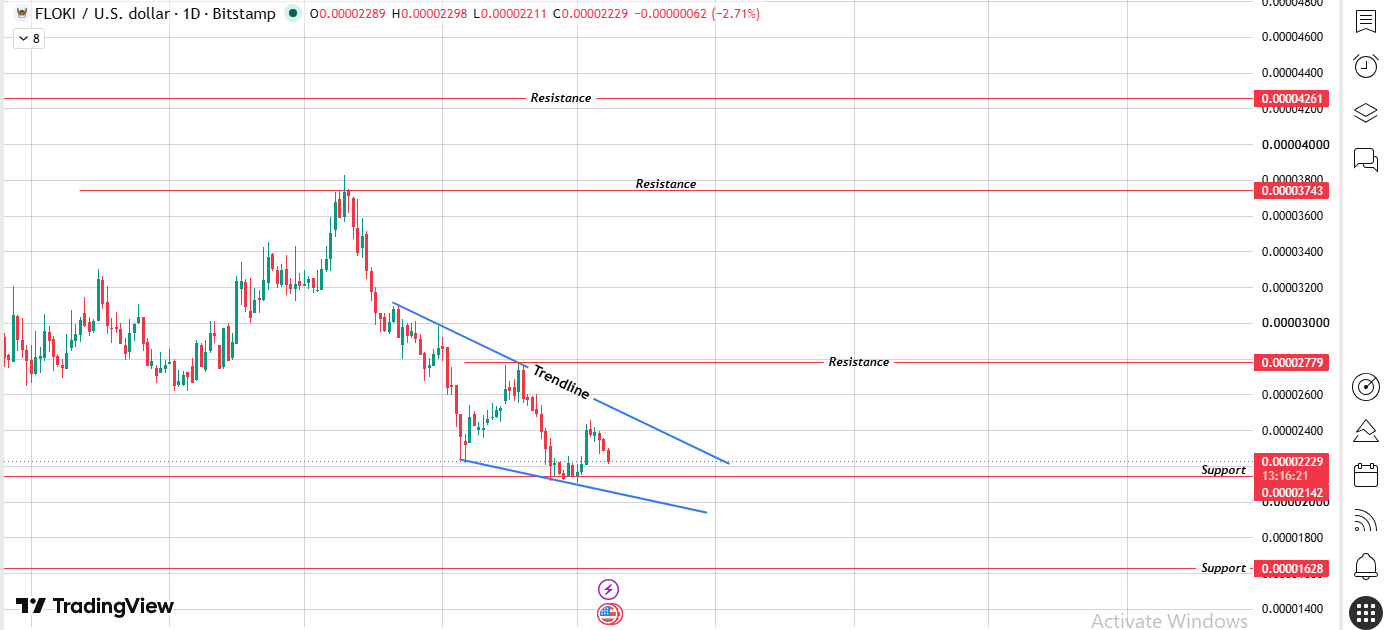
Source: Chart Taken By TradingView
At this point that falling wedge chart pattern is basically acting like a wall between here and a much bigger move.
Trendlines that keep getting tested like this don't hold forever. Eventually one of those tests breaks through, and when it does, the reaction tends to be sharp.
A daily close above this trendline could open the door to a real rally, one that pushes price up toward resistance zones that haven't been touched in a long time.
Rejections build pressure , and once that pressure finally releases, buyers usually show up in a hurry.
Until that break actually happens, though, the path of least resistance still leans sideways to down. So for now, patience matters more than anything else.
1D Key Levels:
| Level | Price (USD) |
|---|---|
| Resistance | 0.00004261 |
| Resistance | 0.00003743 |
| Resistance | 0.00002779 |
| Current Price | 0.00002229 |
| Support | 0.00002142 |
| Support | 0.00001628 |
Possible FLOKI Price Target for 2027
So what's actually on the table if things swing FLOKI's way? If that daily trendline finally breaks and FLOKI Price Prediction 2027 works through its major resistance levels one at a time, a move toward the 0.00003743 – 0.00004261 zone isn't unrealistic for 2027.
That would be a solid multi-fold move from where price sits today, but it would need real volume behind it, a broader recovery across altcoins, and continued strength in meme coins overall.
That said, this is the optimistic path. It only plays out if FLOKI actually breaks structure cleanly instead of getting rejected again like it has so many times before.
Nothing here is set in stone, and any price target in crypto should be treated as a possibility, not a guarantee.
Bottom Line
FLOKI Price Prediction 2027 is sitting at a real crossroads right now. The descending channel on the 4H and the falling wedge pattern on the daily are basically pointing to the same thing from two different angles: pressure is building and a decision is close.
Which way it breaks depends entirely on which of these levels gives way first.
For now, keep an eye on that falling wedge trendline and the channel boundaries. Whichever direction FLOKI eventually breaks, it probably won't be a slow one.
Disclamier: This article is for informational purposes only and is not financial advice. Crypto markets are highly volatile, so always do your own research before making any trading decisions.