BlockDAG Price Prediction: Can BDAG Break Above $0.00006874?


The BlockDAG price today has been quietly grinding higher for weeks, and BDAG is now testing a key resistance zone after months of recovery from its post-launch lows.
The project is a Layer 1 blockchain combining Directed Acyclic Graph (DAG) architecture with proof-of-work consensus, aiming for high transaction throughput without sacrificing decentralization.
This BlockDAG Price Prediction looks at whether BDAG can build on this move:
BDAG price today: BDAG Market Overview
Metric | Value |
Price | $0.00005485 |
24h Change | +0.24% |
Market Cap | $4.86M (0%) |
Unlocked Market Cap | $6.25M |
24h Volume | $1.99M (+2.14%) |
Vol/Mkt Cap (24h) | 40.88% |
FDV | $8.22M |
Total Supply | 103.95B BDAG |
Max Supply | 150B $BDAG |
Self-Reported Circulating Supply | 90.83B $BDAG |
Profile Score | 87% |
Source: Data from CoinMarketCap as of 29/07/2026. Figures may vary slightly across other tracking websites.
Network Dashboard and BDAG Token Unlock Schedule Explained
BlockDAG's on-chain dashboard shows the network has processed 15,815,698 total blocks and 4,383,857 total transactions, with circulating supply at 90,872,343,667 BDAG against a total supply of 103,955,673,989 BDAG. 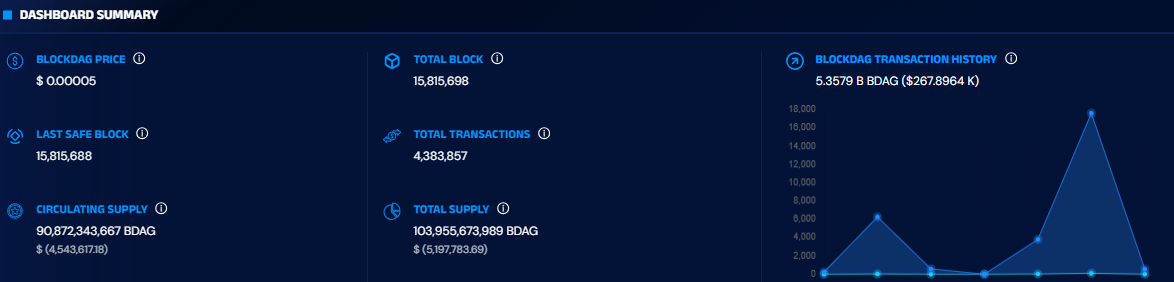
Transaction history data shows a recent spike to 5.36B BDAG (roughly $267.90K) moved in a single period, a raw transaction volume figure, not a trading volume.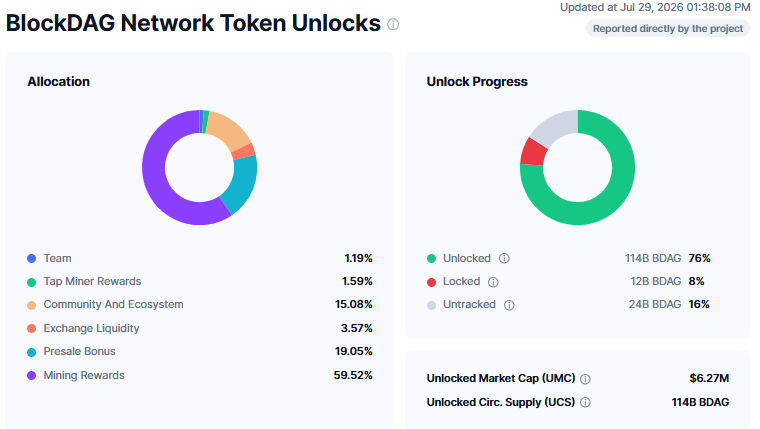
On the token-unlock side, allocation skews heavily toward mining rewards (59.52%) and presale bonus (19.05%), with smaller shares for community and ecosystem (15.08%), Exchange Liquidity (3.57%), Tap Miner Rewards (1.59%), and team (1.19%).
As of July 29, 2026, 76% of total supply (114B $BDAG) has unlocked, 8% (12B BDAG) remains locked, and 16% is untracked.
The unlocked market cap stands at $6.27M, notably above the $4.86M market cap on the price tracker, a gap that lines up with the self-reported circulating-supply flag noted above.
BlockDAG price prediction: Short-Term Chart Analysis
Pair: $BDAG/USDT · Market: Spot · Source: TradingView, chart spans early June through early August 2026 (exact candle interval not labeled)
$BDAG trades at $0.00005485, holding just above its EMA 9 ($0.00005338) and EMA 20 ($0.00005122) after a multi-week grind higher from a base near $0.00003396.
Price recently pushed into the $0.00006032 resistance zone before pulling back to test the EMA cluster and is now attempting to hold that zone as new support.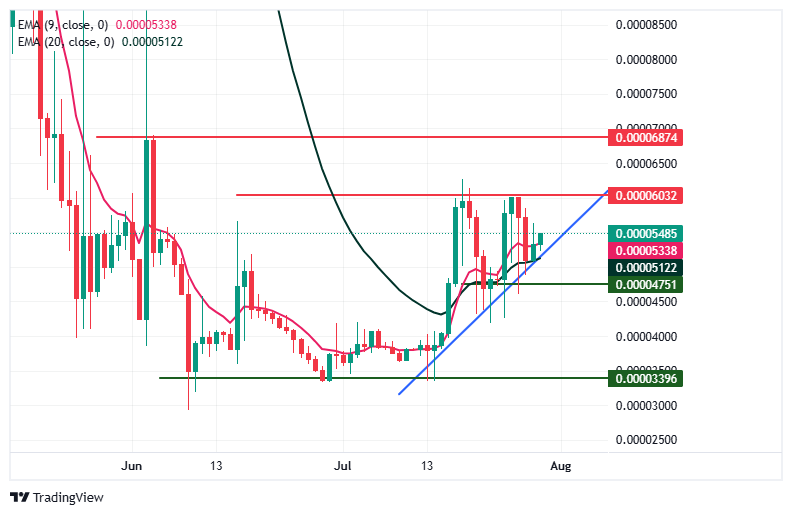
Level Type | Price | Label |
Resistance 2 | $0.00006874 | Prior swing high |
Resistance 1 | $0.00006032 | Recent supply zone |
Immediate Price Reference | $0.00005485 | Current price |
EMA Support | $0.00005338 | EMA 9 |
EMA Support | $0.00005122 | EMA 20 |
Support | $0.00004751 | Prior base |
Floor Support | $0.00003396 | Multi-week low |
BlockDAG price prediction 2026: Long-Term Chart Analysis
Pair: $BDAG/USDT · Market: Spot · Source: TradingView, broader view spanning April through October 2026 (exact candle interval not labeled)
$BDAG's wider chart tells a more volatile story: the price spiked sharply in April before collapsing through May and bottoming in a low-volume base through June.
The recent recovery has been steady but has not yet reclaimed the $0.00006310 or $0.00008988 zones that marked resistance earlier in the year.
Recorded volume on this view sits at 14.247M, concentrated mostly around the April volatility rather than the recent grind higher.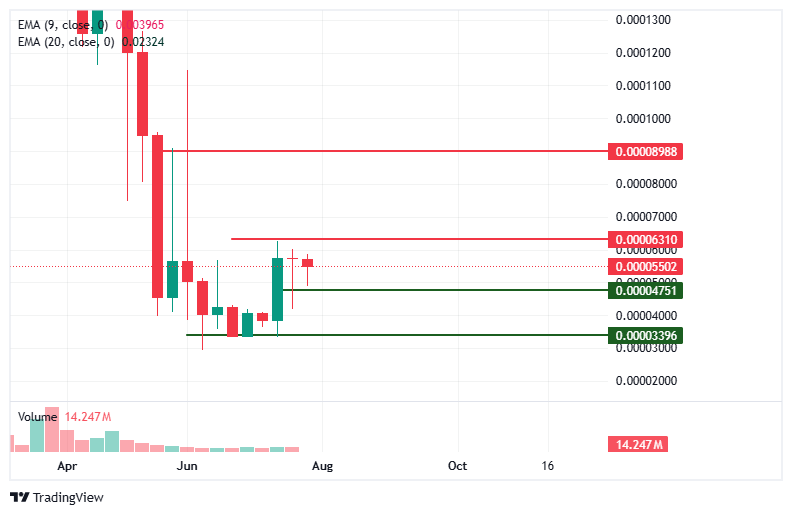
Level Type | Price | Label |
Resistance 2 | $0.00008988 | Prior high |
Resistance 1 | $0.00006310 | Descending supply zone |
First Confirmed Support | $0.00004751 | Recent base |
Deeper Support | $0.00003396 | Multi-week low |
BlockDAG forecast 2026: Bull Case vs. Bear Case
Bull case: If $BDAG holds above the EMA 9/EMA 20 cluster near $0.00005122–$0.00005338, the next targets are $0.00006032 and then $0.00006874. A strong close above that zone could put the longer-term resistance at $0.00008988 in play.
Bear case: A confirmed break back below $0.00004751 would signal the recovery is stalling, opening a retest of the multi-week low at $0.00003396.
Can BDAG Reach $0.00008988?
It's possible over a longer horizon but requires the current recovery to keep building.
$BDAG would need to clear $0.00006032 and $0.00006874 with sustained volume before the higher long-term resistance at $0.00008988 becomes realistic—a level the price hasn't tested since earlier in the year.
What Happens If Support Breaks?
A confirmed break below $0.00005122 would be the first warning sign, and a deeper break below $0.00004751 would open a retest of the $0.00003396 multi-week low, unwinding much of the recent recovery.
Expert View
According to CoinGabbar analysts, $BDAG's chart shows a genuine, if slow, recovery price has been building higher lows since June rather than spiking and fading.
But with 76% of supply already unlocked and mining rewards making up nearly 60% of total allocation, ongoing token emissions remain a structural headwind that could cap upside unless demand growth outpaces new supply hitting the market.
Disclaimer: This article is for informational purposes only and should not be treated as investment advice. Cryptocurrency markets are highly volatile, and readers should conduct their own research before making any financial decisions.









.jpg)








