Bitcoin Cash Price Prediction: BCH at a Critical Breakout Zone


Bitcoin Cash price prediction traders have been watching one thing all day, and it's finally coming to a head.
BCH has spent days getting squeezed inside a falling channel, and the price is now sitting right on top of the one level that decides whether this turns into a breakout or another leg lower.
The kind of setup where the next candle actually matters. Let's get into what's on the chart.
This analysis is based on a 1-hour chart structure and short-term liquidation data, so it reflects near term positioning only and should be rechecked if the price moves outside the range below.
Bitcoin Cash Price Right Now
Metric | Value |
Current Market Price (CMP) | $213.26 |
24h Change | -0.66% (-$1.4169) |
24h Futures Volume | $90.32M |
24h Spot Volume | $6.62M |
Market Cap | $4.27B |
Open Interest | $312.01M |
Circulating Supply | 20.07M BCH |
Total/Max Supply | 21.00M BCH |
Open interest is the total value of futures contracts still open on an exchange. At $312.01M against a $4.27B market cap, BCH is carrying a meaningful amount of leveraged positioning relative to its size, which helps explain why price has been reacting sharply to small moves inside this channel.
Source: CoinGlass, captured 12 August 2026, 13:54 IST (08:24 UTC). Chart source: TradingView, BCH/USDT Perpetual, Bybit, 1-hour timeframe, same timestamp.
Bitcoin Cash's Longer-Term Performance Puts the Setup in Context
The short-term picture looks fairly quiet on its own: BCH is down just 0.06% over 4 hours and 0.66% over 24 hours and is actually up 0.02% over the past week.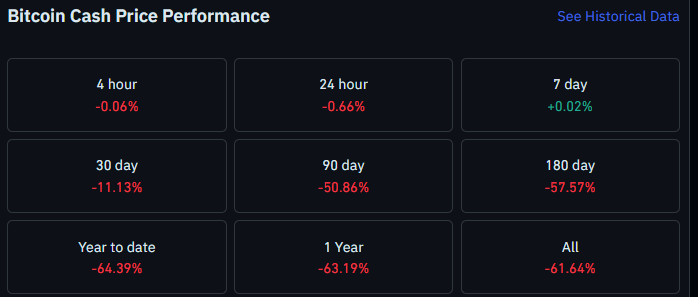
Zoom out further and the trend looks far heavier, with BCH down 11.13% over 30 days, 50.86% over 90 days, and 57.57% over 180 days.
Year to date, it's down 64.39%, and it remains 61.64% below its all-time high. This falling channel is playing out inside a much bigger downtrend that has only recently started to stall.
Source: CoinGlass Bitcoin Cash price performance data, same timestamp.
Liquidation Data
Liquidations today have leaned almost entirely toward longs getting squeezed.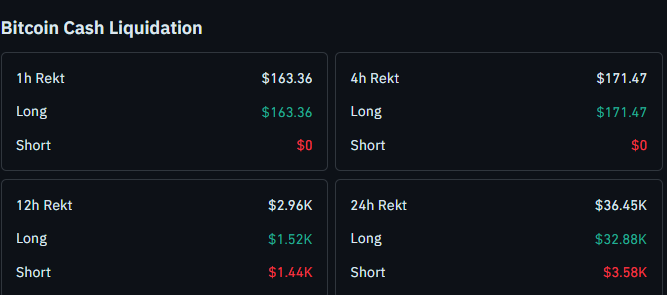
In the last hour, $163.36 was liquidated in total, and every dollar of it came from long positions, with zero in shorts.
The 4-hour window shows the same one-sided pattern: $171.47 total, all of it long.
The 12-hour window is more balanced, with $2.96K liquidated overall, split between $1.52K in longs and $1.44K in shorts.
Over 24 hours, $36.45K was liquidated in total, and longs again dominated at $32.88K against just $3.58K in shorts, consistent with a market that keeps getting caught buying into channel resistance.
Source: CoinGlass Liquidation data , same timestamp.
Key Takeaways
BCH trades near $213.26, down 0.66% over the past 24 hours, pressing against falling-channel resistance
A close above $215.9 opens the path to $218.8, then $221.8, with $226.8 as the major target
A close below $210.4 shifts focus to $208.4 as the next support
All levels referenced here are recent swing highs and lows on the 1-hour chart
Long positions have taken the overwhelming share of liquidations across every timeframe today
Bitcoin Cash Price Prediction: What the Chart Shows
BCH is trading inside a falling channel, a pattern formed by two parallel downward-sloping lines connecting recent lower highs and lower lows.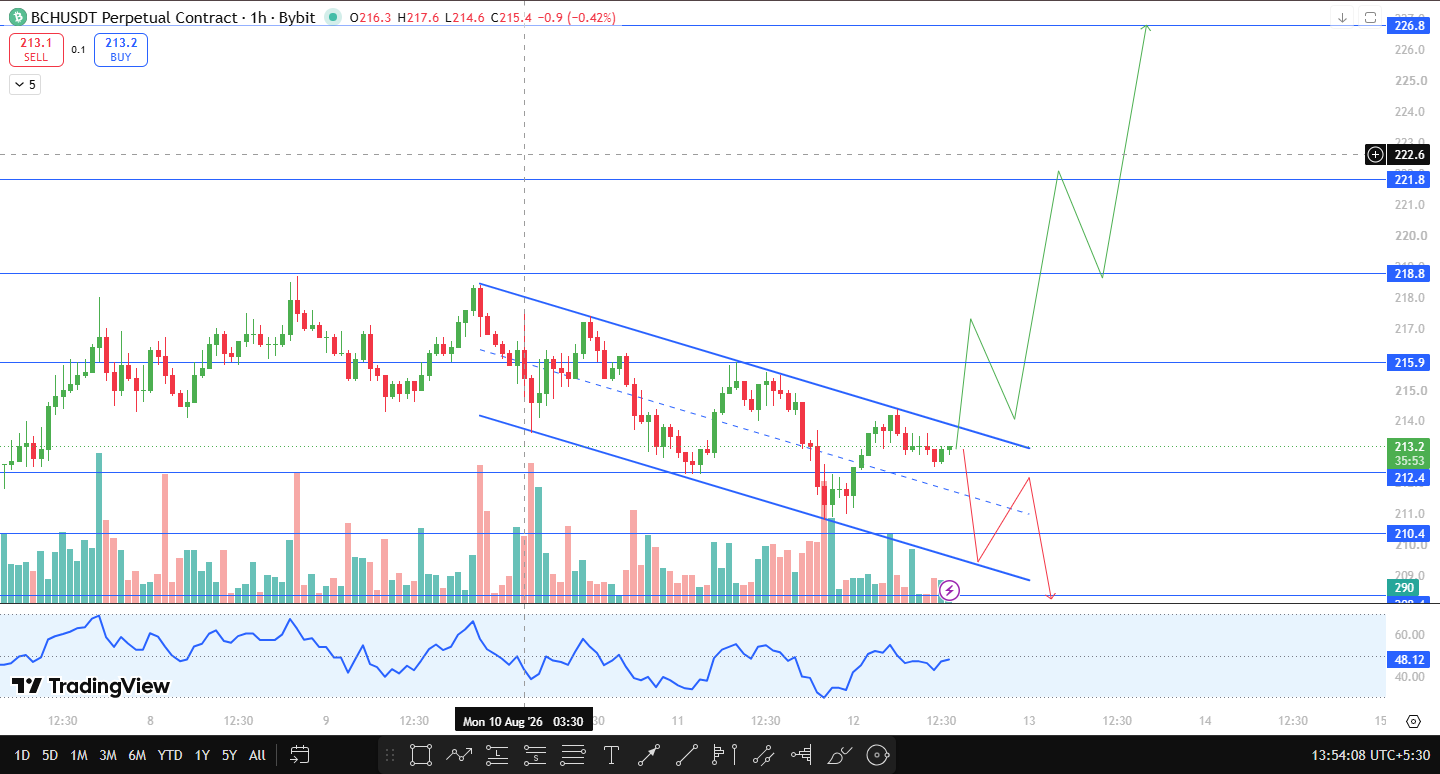
Price is currently pressed right against the upper boundary of that channel, which is acting as resistance.
The RSI on this chart is reading 48.12, just under the neutral 50 mark.
That's a fairly balanced reading, which fits a market sitting right at a decision point rather than showing strong momentum in either direction yet.
A close above $215.9 would break the channel structure to the upside.
That opens the door to $218.8 as the first target, followed by $221.8, with $226.8 marked as the major resistance beyond that.
On the other side, if BCH fails here and closes below $210.4, the next support to watch is $208. 4.
All of these levels, both above and below the current price, come from recent swing highs and lows on this timeframe.
Bitcoin Cash Support and Resistance Levels to Watch
Type | Level | Note | % From CMP |
Support | $210.4 | Recent swing low | -1.3% |
Breakdown support | $208.4 | Recent swing low; next level if $210.4 fails | -2.3% |
Channel resistance | $215.9 | Recent swing high, upper channel boundary | +1.2% |
Resistance | $218.8 | Recent swing high | +2.6% |
Resistance | $221.8 | Recent swing high | +4.0% |
Major resistance | $226.8 | Recent swing high | +6.4% |
Risk-Reward Table
Case | Trigger | Target |
Bull Case | Close above $215.9 | $218.8, then $221.8, then $226.8 |
Bear Case | Close below $210.4 | $208.4 |
What Would Change This Bitcoin Cash Price Prediction
This setup is genuinely two-sided right now. A close above $215.9 breaks the falling channel and shifts focus toward $218.8 and the levels beyond it.
A close below $210.4 does the opposite, putting $208.4 in play as the next support.
Since every level here is a recent swing point rather than a longer-term structural zone, this read should be rechecked if the price closes decisively outside this range within the next several hours.
Glossary
Falling Channel: A pattern formed by two parallel downward-sloping trendlines connecting a series of lower highs and lower lows.
Open Interest: The total value of futures contracts still open on an exchange.
RSI (Relative Strength Index): A momentum indicator, scaled 0-100, showing whether an asset is being bought or sold aggressively relative to its recent range.
Swing High/Low: A short-term peak or trough in price used to mark recent support and resistance levels.
Disclaimer
This content is for informational purposes only and does not constitute financial or trading advice. Cryptocurrency markets are highly volatile and leveraged positions carry substantial risk of loss. Always do your own research before making trading decisions. CoinGabbar and the analyst do not hold a position in BCH at the time of publication.
Also read:

















