Bitway Price Forecast: Can BTW Sustain Its 19% Rally After This?


Bitway Price Forecast: Can BTW Keep Climbing Its Latest Move?
Everyone is watching BTW right now, and for good reason. The token just posted one of its sharpest single-day moves since it started trading, and it's got traders reworking their Bitway price forecast from three different directions.
Is this the start of something bigger or a setup for a hard reversal? There's a wrinkle here that most price charts won't show you, and it changes how you should read this entire rally. Keep that in mind as you read on, because the answer isn't as simple as green candles suggest.
Bitway Price Forecast: What's Actually Happening Right Now
At the time of writing, on August 17, 2026, around 14:00 UTC, BTW is trading near $0.3599, up 19.2% over the past 24 hours, based on CoinMarketCap market data. Volume over the same window sat at roughly $57.77 million, a jump of over 184% from the prior day. That's the kind of volume spike that tells you real money moved, not just noise.
Our Bitway price forecast for the near term leans cautiously bullish, but with a clear caveat. Market cap currently stands near $974.89 million against a fully diluted valuation of about $3.59 billion. That gap matters. It means most of the token's total supply isn't circulating yet, and that has consequences for anyone building a longer-term Bitway price forecast. This chart pattern isn't new either, and it echoes a setup covered in the rounded bottom breakout analysis from earlier this year.
Why Is the BTW Price Moving Today?
Here's the thing: the rally lines up with a breakout on the 4h chart pattern analysis tracked on Bitway's BTWUSDT pair. Price pushed out of a well-formed ascending channel that had been building since early August, with each low sitting higher than the last.
That's a textbook bullish structure, not a random spike. But structure alone doesn't confirm direction. And volume confirmed it here, which is the part that separates a real move from a fakeout. A similar squeeze-driven rally played out before, as tracked in the short squeeze rally breakdown.
Chart Analysis: What the 4H Structure Shows
On the 4-hour timeframe, BTW broke above its EMA20 near $0.319 with real strength behind it, not a thin wick. That EMA20 is now acting as dynamic support, sitting well below the current price and giving the trend some room to breathe before it's tested again.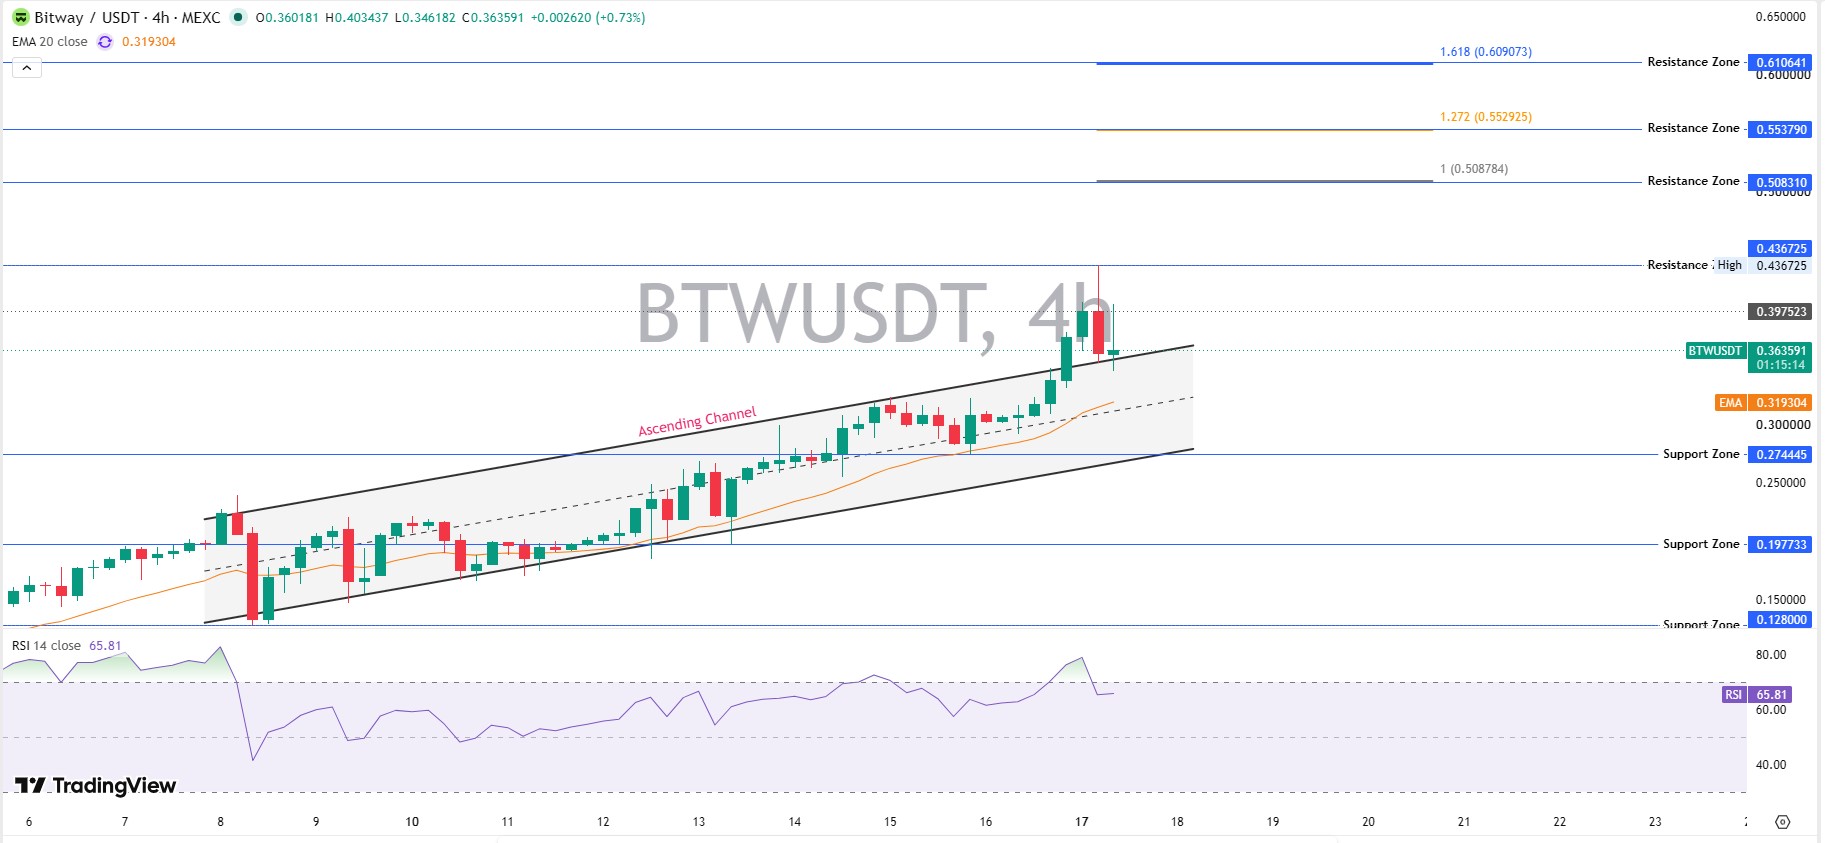
RSI(14) climbed to 65.81. That's comfortably bullish without tipping into overbought territory, which usually starts around 70 on this timeframe. There's still headroom left before momentum traders would call this stretched.
Zoom out to the broader structure, and the story gets clearer. Price has been carving out a well-defined ascending channel since early August, with each swing low landing higher than the one before it. That's the definition of a healthy uptrend. The breakout candle punched through the top of that channel on volume, which is exactly what you want to see confirming a real move rather than a false start.
Resistance zones sit at $0.508, $0.554, and $0.611, based on Fibonacci extension levels drawn from the most recent swing low to swing high. Those are the 1.0, 1.272, and 1.618 extensions, and each one lines up with a prior area of supply. Support has stacked up in three tiers below: $0.274, $0.198, and $0.128, each corresponding to earlier consolidation zones the chart has already respected once.
Volume backed the move too, with the 24-hour figure jumping over 184% against the prior session. Price above every short-term moving average that matters, RSI with room to run, and a channel breakout on rising volume. That's about as clean a bullish technical setup as this chart has shown in weeks.
But structure alone doesn't guarantee follow-through, and one candle doesn't rewrite the bigger risk picture sitting underneath it.
Altcoin Risk Section: The Wallet Concentration Problem
This is the part most coverage skips, and it's the single biggest risk to any Bitway price forecast right now. On-chain data from BscScan holder records shows one wallet controlling 72.9% of the entire circulating supply. The top ten wallets combined hold over 99%. The Gini distribution score reads 0.9999, about as concentrated as a token can get.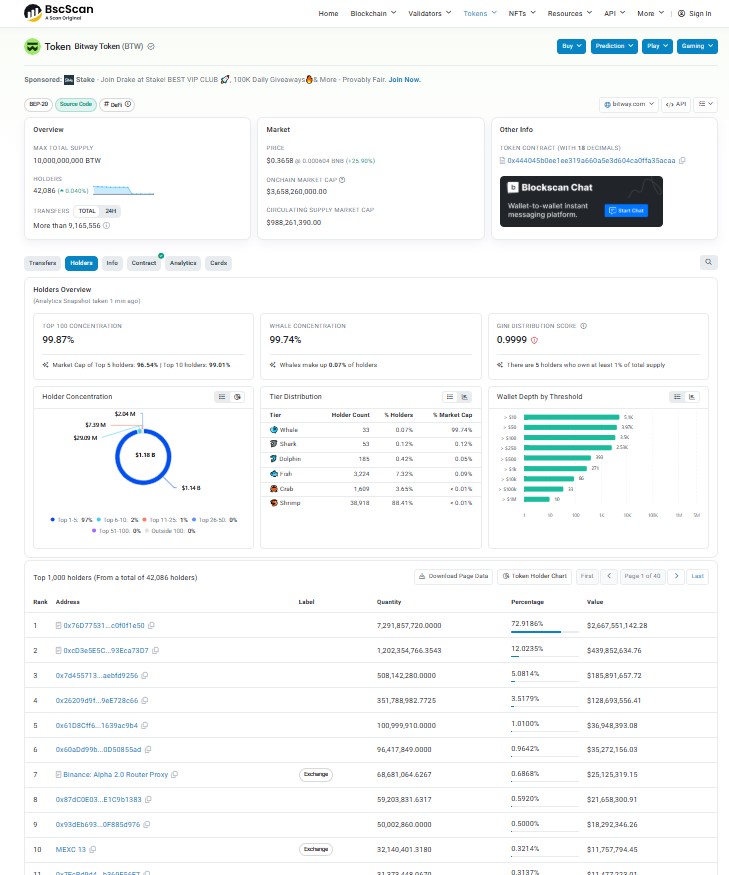
Whale concentration this extreme means a single large sell order could crush price far faster than any support zone would suggest. It's not that this will happen. It's that it can, and retail holders have almost no visibility into that wallet's intentions. Some of that concentrated supply reportedly traces back to exchange and staking wallets, a theme explored in the binance wallet staking analysis.
Liquidity is thin too. According to coinglass liquidation and volume data, the liquidity-to-market-cap ratio sits near 0.20%, and 24-hour liquidations hit $1.42 million, with shorts taking the bigger hit at $1.17 million. That short squeeze partly explains today's spike.
Price forecast: Bear, Base, and Bull Scenarios
Timeframe | Bear Case | Base Case | Bull Case | Probability | Invalidation |
7 Days | $0.28–$0.32 | $0.34–$0.42 | $0.45–$0.53 | Bear 30% / Base 45% / Bull 25% | Daily close below $0.28 |
30 Days | $0.22 | $0.38–$0.55 | $0.65–$0.80 | Bear 30% / Base 45% / Bull 25% | Weekly close below $0.22 |
Early 2027 | $0.15 | $0.50–$0.90 | $1.10–$1.40 | Bear 25% / Base 45% / Bull 30% | Loss of higher-low structure since August 2026 |
Turns out, most of the bull-case upside depends less on chart patterns and more on whether that whale wallet stays quiet. Watch the bitway price forecast next targets coverage for how prior surges of this size resolved.
Risks to This Bitway Price Forecast
Extreme wallet concentration tops the list. Thin liquidity comes next, since a 0.20% liquidity-to-market-cap ratio means large orders move price disproportionately. Add in general crypto exchange listing volatility and broader market sentiment, and this remains a high-risk, high-volatility asset. Nobody should treat any Bitway price forecast as guaranteed. It's worth keeping an eye on the upcoming coin events calendar for catalysts that could shift this outlook either way.
Glossary
RSI (Relative Strength Index): Measures whether an asset is overbought or oversold.
EMA (Exponential Moving Average): A trend line that weights recent prices more heavily.
FDV (Fully Diluted Valuation): Market cap if all tokens were circulating.
Gini Score: Measures how concentrated token ownership is among holders.
Key Takeaways
BTW is up 19.2% in 24 hours, trading near $0.3599 as of August 17, 2026.
The base-case Bitway price forecast points toward $0.34–$0.42 over the next week.
One wallet holds 72.9% of the circulating supply, the biggest risk factor here.
Resistance sits at $0.508; support sits at $0.274.
Track ongoing bitway btw price forecast coverage for updates as this develops.
Disclaimer: This article is for informational purposes only and does not constitute financial advice. Cryptocurrency markets are highly volatile, and prices can move sharply in either direction. Always do your own research before making any investment decisions.













.webp)








