Bitway Price Prediction ($BTW): Short Squeeze Sends BTW Up 28% Today


This Bitway price prediction breaks down what's driving Bitway's price today, what the charts say for the rest of 2026, and where the real risk sits before you treat any $BTW coin price prediction as a green light.
Direction: Short-term momentum is bullish, but it's leverage doing the lifting, not fresh demand.
Immediate forecast: a cooldown toward $0.085-$0.095 looks more likely than an instant push to new highs.
Key support: $0.07138, with a harder floor near $0.0486.
Key resistance: $0.11844, then $0.13312.
Invalidation: a daily close under $0.0714 breaks the bullish case.
Base case: BTW drifts between $0.09 and $0.12 while RSI cools off.
Table of Contents
-
Why BTW Is Moving Today
-
Bitway Technical Analysis: What The Charts Show
-
Tokenomics And Whale Concentration
-
Where BTW Is Actually Trading
-
Bitway Next Price Target: Scenarios By Timeframe
-
Will Bitway Reach $1?
-
Bitway Market Outlook: Risks To Watch
-
Glossary
-
Methodology
Key Takeaways
-
BTW trades near $0.106, up roughly 28-31% in 24 hours.
-
Short liquidations ($120.21K of $199.12K over 24 hours) outpaced longs, pointing to a squeeze.
-
The weekly chart shows a symmetrical-triangle breakout; daily RSI at 71 is stretched.
-
One wallet holds 78% of supply. Ten wallets hold 99%. That's not normal.
-
BTW sits 46% below its June all-time high of $0.1903.
Why Everyone's Watching BTW Again
A token that had gone quiet just posted one of its sharpest single-day moves in weeks, and that tends to pull traders back in fast. There's no confirmed listing or partnership behind it that we could verify. But there is a clear derivatives story underneath it.
BTW is up close to 29% in a day, with CoinMarketCap showing the token near $0.106, up between 28.6% and 29% over 24 hours depending on the exact snapshot. Either way, that's a real move on a token that had been fading.
So is this the start of a trend or a mechanical bounce that fades once shorts are cleaned out? It's worth checking our Bitway short squeeze rally breakdown for more context before deciding.
What Actually Happened
Here's the thing: liquidation data does most of the talking here. Over 24 hours, $BTW saw $199.12K in total liquidations, and $120.21K of that came from shorts getting forced out, against $78.91K on the long side. The 12-hour window shows the same lean, $110.35K in short liquidations versus $64.69K in longs, per Coinglass liquidation tracking.
That's a squeeze pattern. Shorts piled in, price ticked up, stops triggered, and covering fed on itself.
Trading volume tells a related story. Spot volume sits around $22.79M, down 34.58% on the day. But futures volume across exchanges adds up to well over $120M once you total Binance, Bybit, Bitget, Gate, and the rest. When futures volume dwarfs spot this badly, leverage is driving the move, not organic buying.
Bitway Technical Analysis: What The Charts Show
This is the core of any real Bitway technical analysis right now, and it's worth looking at the daily and weekly timeframes separately since they're telling slightly different stories.
Daily Chart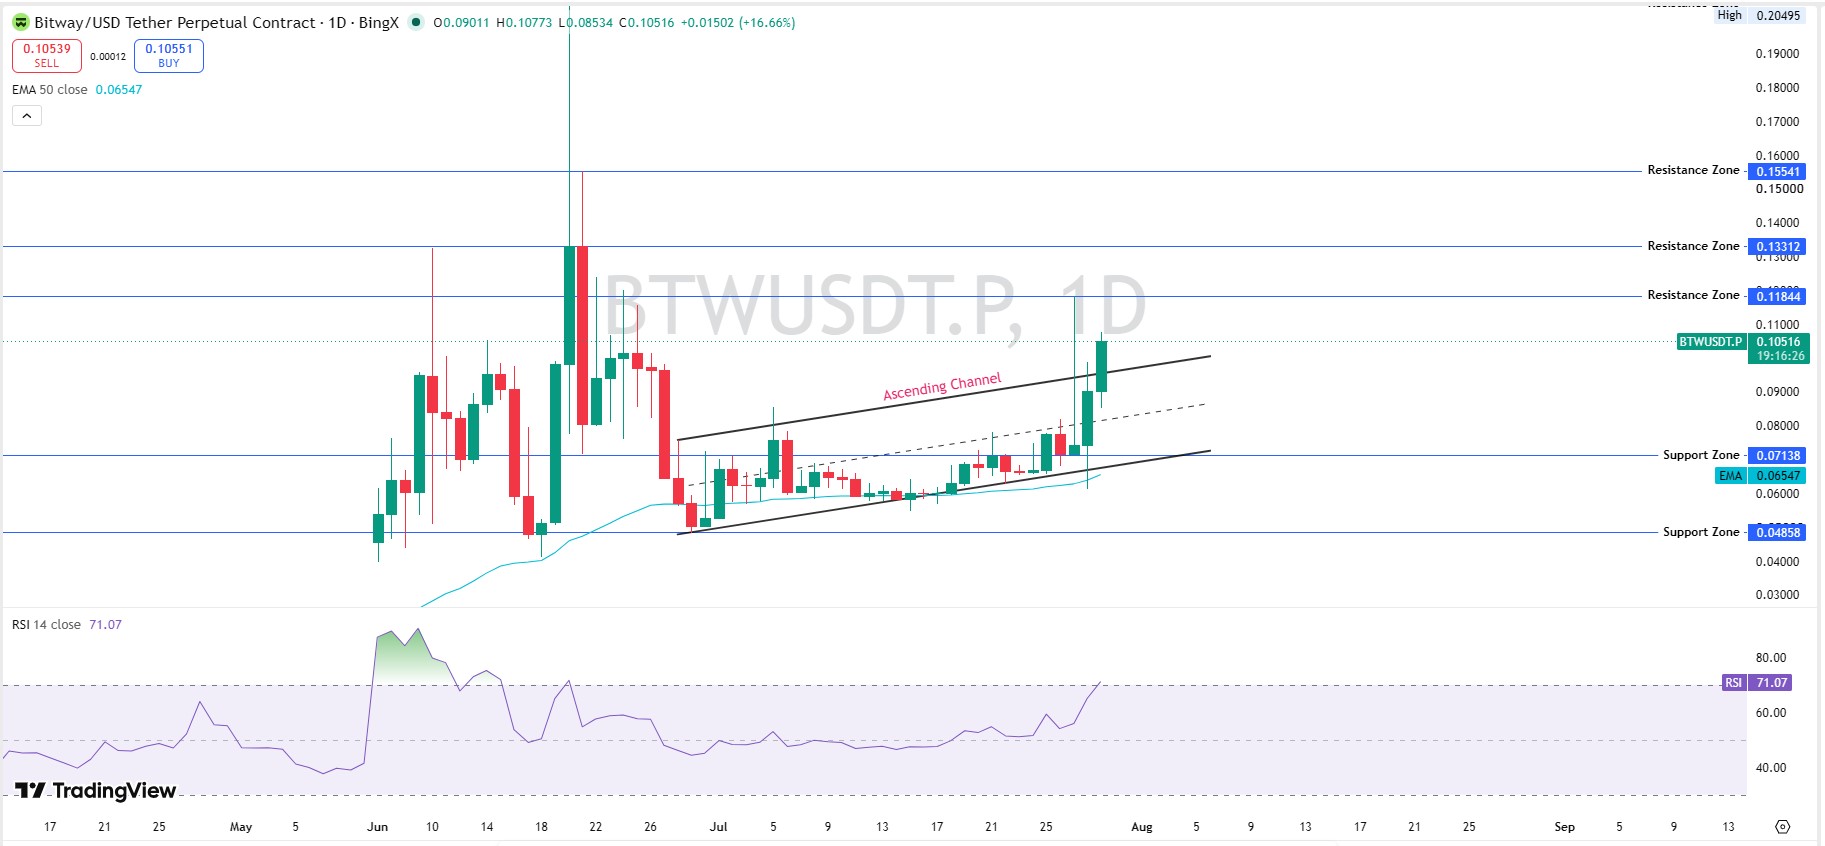
On the daily timeframe, $BTW broke out of an ascending channel that had capped price since June, moving from roughly $0.090 to a high near $0.108 in a single session. Daily RSI sits at 71.07, comfortably in overbought territory (RSI above 70 usually signals a stretched move). You can track this setup live on TradingView's chart tools.
Weekly Chart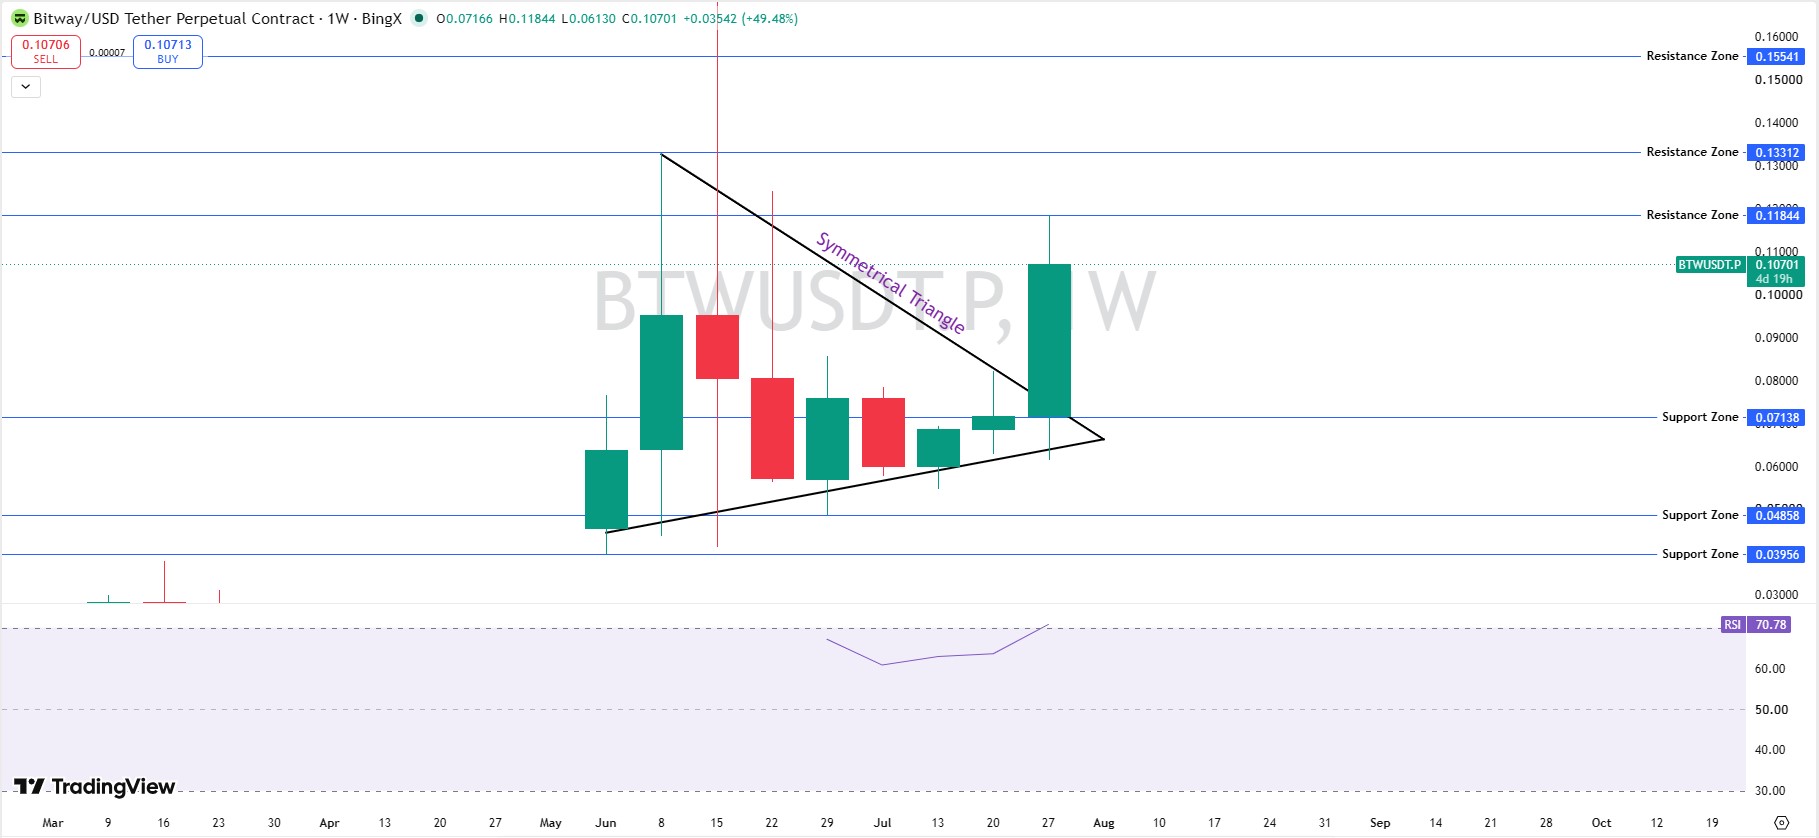
The weekly chart tells a slightly calmer story, and it's the part most breakout-analysis threads miss. BTW broke out of a symmetrical triangle that had formed since March, closing the week up nearly 50%. Weekly RSI sits at 70.78, still hot, but the structure looks less exhausted than the daily.
Bitway Support and Resistance
Resistance sits at $0.11844, then $0.13312, then $0.15541. Support sits at $0.07138, with a deeper floor at $0.04858. The 50-EMA on the daily is way down at $0.06547, a reminder of how far this token had drifted before the bounce. These are the levels worth watching for the next Bitway next price target, not the round-number $1 figure some hopeful posts throw around.
For a sense of how a similar breakout unfolded elsewhere, our ascending channel breakout analysis covers a comparable setup, and it's a useful companion to this Bitway breakout analysis.
Tokenomics And Whale Concentration
$BTW has a 10 billion max supply, with 2.2 billion circulating, per CoinMarketCap's token page. Market cap sits around $233M-$234M against an FDV near $1.06 billion, which is a steep premium once the rest of supply is unlocked. Holder count sits at roughly 45,700 to 45,728, depending on the source.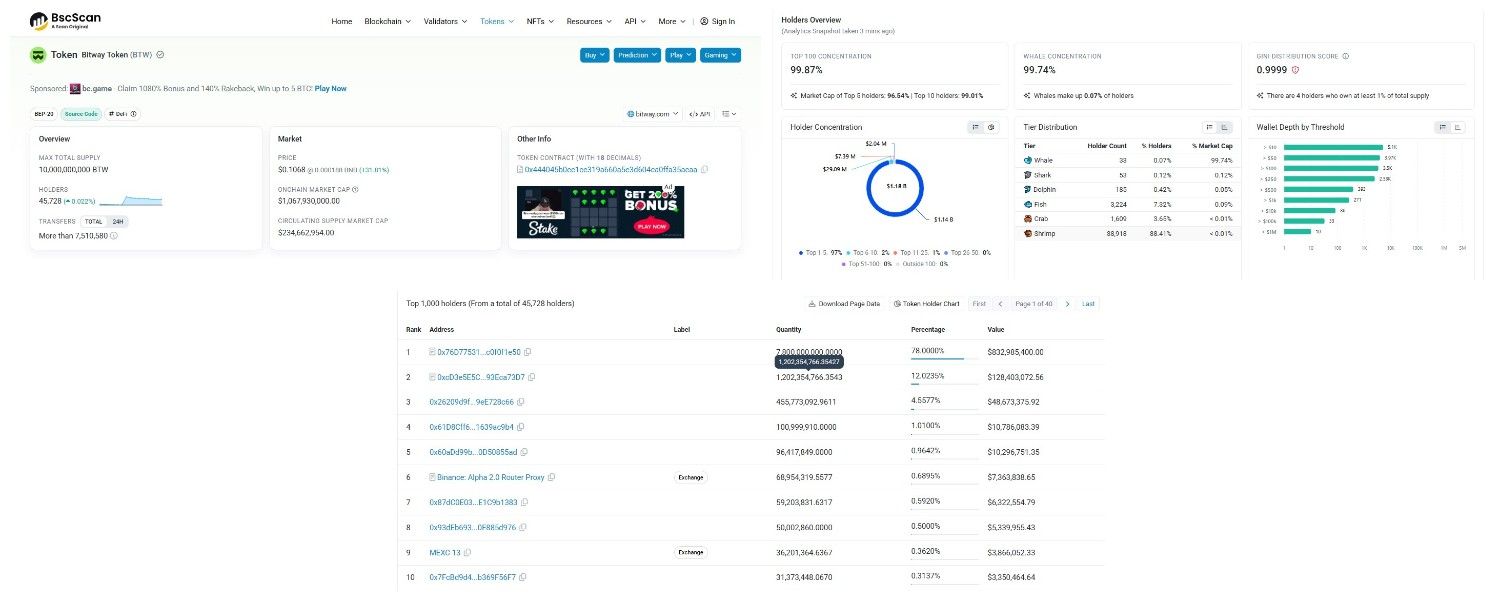
Now, the risk that actually matters. Top-holder data shows one wallet controls 78% of supply, the second-largest holds another 12%, and the top ten combined control 99.01%. The Gini distribution score sits at 0.9999, about as concentrated as a token can get. Only 33 wallets qualify as "whales," yet they hold 99.74% of the market cap between them, per BscScan's holder breakdown.
We can't confirm what the largest wallet actually is. Transaction labels only identify two addresses directly, a Binance Alpha router and an MEXC deposit wallet. The rest could be a treasury, a vesting contract, or a liquidity pool rather than a single holder, and that distinction matters before calling this whale risk outright.
BTW also carries a CertiK rating of 4.2 out of 5, which is respectable, though a good audit score doesn't offset concentration risk on its own.
Where $BTW Is Actually Trading
Binance carries the bulk of futures volume at roughly $68M, followed by Bybit near $16M and smaller slices across Bitget, Gate, MEXC, BingX, KuCoin, Bitunix, and Aster. That concentration on one venue means any Binance-side issue would hit BTW's liquidity fast. Our exchange listing coverage tracks where new liquidity tends to show up first.
Bitway Next Price Target: Scenarios By Timeframe
Treat the table below as a Bitway weekly price prediction and a longer Bitway long-term forecast side by side, not as trading signals to copy blindly.
| Timeframe | Bull Case | Base Case | Bear Case |
|---|---|---|---|
| 24H | Holds above $0.11 and pushes toward $0.133 as shorts continue covering (Probability: Moderate). | Cools to the $0.09–$0.10 range as RSI resets (Probability: High). | Fails at $0.095 and slips back toward $0.085 (Probability: Low–Moderate). |
| 7D | A weekly close above $0.118 flips the near-term structure bullish. | Trades range-bound between $0.08–$0.12 inside the recent triangle. | Breaks below $0.0714 and retests the $0.0486 support zone. |
| 2026 | Sustained volume and exchange activity build momentum toward the prior high near $0.19. | Price drifts within a $0.09–$0.14 range as short-squeeze effects fade. | Renewed selling from concentrated wallets drags BTW toward its March low near $0.0077. |
Invalidation for the bullish thesis is a daily close under $0.0714. A close under $0.0486 would confirm a deeper breakdown. These are directional, not guarantees, and probability terms above reflect relative likelihood, not statistical certainty.
Will Bitway Reach $1?
Not on this move, and not without a supply story that looks nothing like today's. Getting from roughly $0.106 to $1 is close to a 9-10x, and with an FDV already near $1.06 billion, that would push valuation into territory way out of step with current volume and holder count. It's not off the table over a multi-year Bitway long-term forecast if adoption and unlock absorption both go right, but as a near-term Bitway bullish price prediction, it isn't realistic.
Bitway Market Outlook: Risks To Watch
Any honest Bitway investment analysis has to start with whale concentration, which tops the list here, with ten wallets controlling effectively all of the supply. Leverage-driven volume is another risk; futures activity is running several multiples above spot. Add unresolved wallet identity questions and single-exchange liquidity concentration, and volatility isn't going anywhere soon.
As a low-cap crypto with thin order books, $BTW behaves very differently than the large-cap names that usually anchor a broader crypto market analysis. If you're scanning for emerging crypto projects or building a watchlist of the best altcoins to watch, treat concentration and liquidity depth as filters, not footnotes. For broader digital asset forecast context, see our Ethereum price prediction 2026 coverage, since BTW's move is unfolding alongside a broader risk-on tone.
Glossary
-
RSI (Relative Strength Index): A 0-100 momentum gauge; above 70 usually flags an overbought, stretched move.
-
EMA (Exponential Moving Average): A moving average that weights recent prices more heavily, used here to gauge trends.
-
FDV (Fully Diluted Valuation): What the market cap would be if all tokens, including locked ones, were circulating.
-
Gini Score: A 0-to-1 measure of distribution; closer to 1 means supply is concentrated in very few hands.
-
Higher-low: A chart pattern where each price dip sits above the last, often read as a sign of building support.
Methodology
-
Chart levels came from BTW/USDT daily and weekly charts on BingX via TradingView, using RSI-14, the 50-EMA, and visible channel and triangle structure captured on July 29, 2026.
-
Supply, market cap, and price performance data came from CoinMarketCap.
-
Holder concentration and contract data came from BscScan's balances page for the BTW BEP-20 contract.
-
Liquidation and exchange volume data came from Coinglass.
-
This is a live snapshot, not a static historical figure, and levels can shift as new data comes in.
-
Unlike a generic, automated Bitway AI price prediction model, every level here traces back to a specific chart, wallet list, or exchange dashboard cited above.
-
For the latest Bitway coin news and Bitway token news, keep an eye on exchange listings, unlock schedules, and holder movements rather than price alone.
Disclaimer: This is speculative market commentary, not financial or investment advice. Crypto assets are volatile and can lose most or all of their value. Data is current as of July 29, 2026; verify live figures before trading.









.jpg)








