Ether.fi Price Prediction: Breakout Test at the $0.515 Wall


Ether.fi has spent months rebuilding from deep lows, and that recovery is now running straight into a wall.
Price is pressing against the top of a channel that has held since June, and how it behaves here will say a lot about what comes next.
This Ether.fi price prediction walks through the chart structure, derivatives positioning, and the levels that matter most right now.
$ETHERFI Just Woke Up: The Numbers Behind the Move
Ether.fi is trading at $0.5111, up 8.61% over the last 24 hours. Market cap data shows the figure at $520.45M, up 13.6%.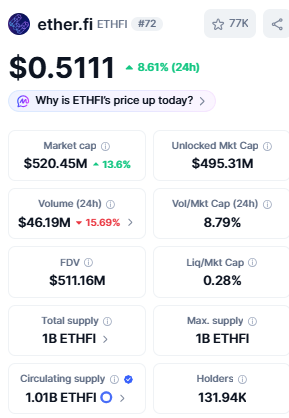
24-hour trading volume stands at $46.19M, down 15.69% even as price advanced, with circulating supply at roughly 1.01B $ETHFI against a 1B max supply and a holder base of 131.94K.
Data source: CoinMarketCap
What Are Futures Traders Signalling?
Futures activity is concentrated on Binance, which carries $27.92M in volume, ahead of LBank ($15.45M), OKX ($10.97M), Bybit ($9.25M), BingX ($9.22M), and MEXC ($9.13M), with the remainder spread across WhiteBIT, Hyperliquid, Gate, Bitget, and Bitunix.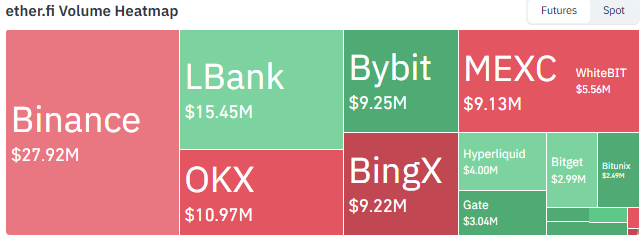
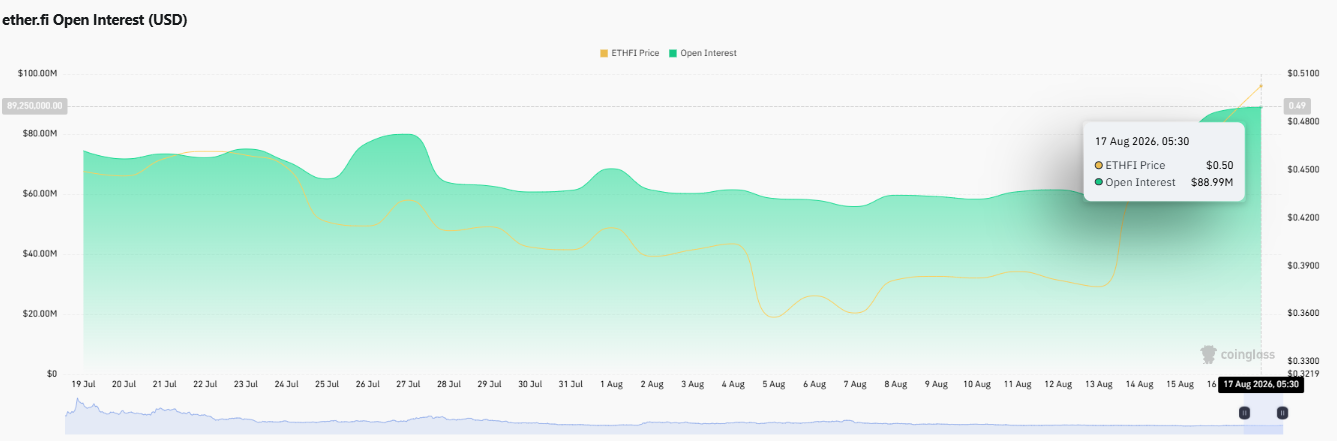
Open interest has climbed to $88.99M as of 17 August 2026, up from a range that had mostly held between $60M and $80M through July and early August, tracking the recent push in price toward the $0.515 zone.
Positioning leans long. Binance's account-based long/short ratio stands at 1.2065, and top trader accounts show a similar 1.1911 ratio.
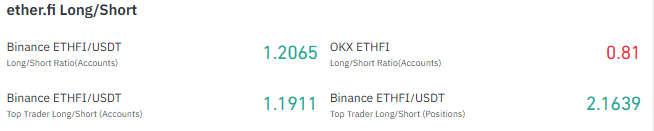
The top trader position-weighted long/short ratio is notably higher at 2.1639, pointing to a strong long bias by position size.
OKX tells a different story, with its ratio at 0.81, reflecting more short-biased positioning on that exchange.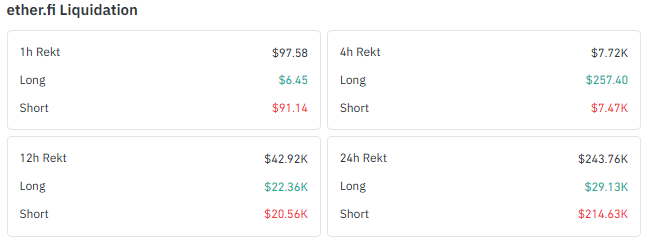
Liquidation data supports the bullish tilt in this move: 24-hour liquidations total $243.76K, with $214.63K coming from short positions against just $29.13K in longs, consistent with shorts being squeezed as price pushed toward resistance.
Data source: CoinGlass
Showdown at $0.515: What Ether.fi's Chart Is Telling Us
$ETHFI is trading near the $0.515 resistance zone, a level that has capped upside for months.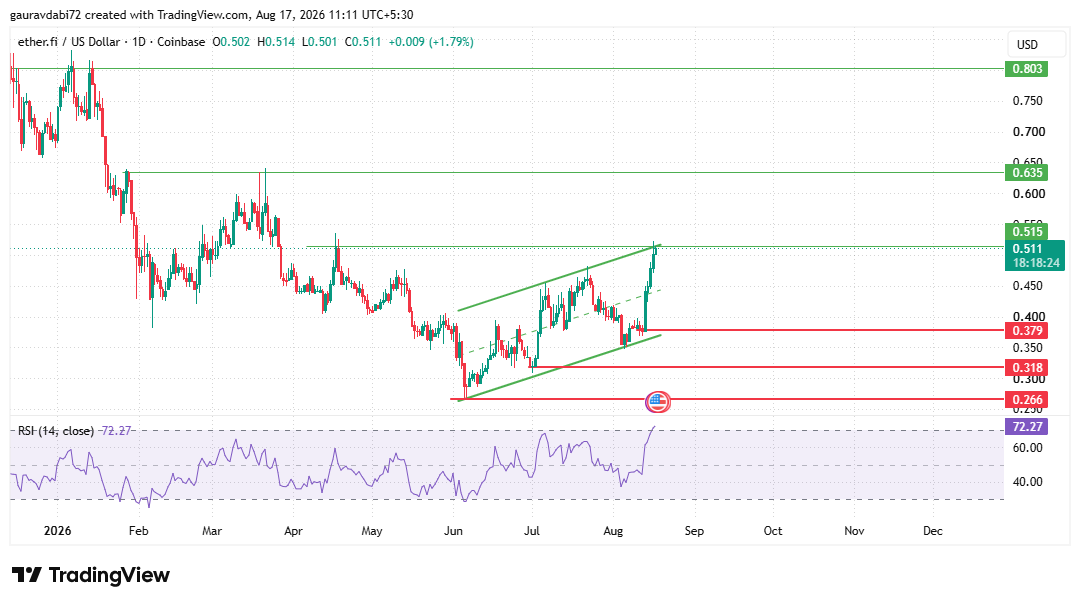
Price is currently testing the upper boundary of a multi-month ascending channel that has been forming since June, and the reaction here will likely set the tone for the next several weeks.
The $0.515 zone matters because it sits at the top of the channel and marks a level where sellers have previously stepped in.
A sustained break above $0.515 would confirm that buyers have absorbed supply at this ceiling and would open the path toward $0.635, followed by $0.803 further out.
A rejection from this zone would carry a different message. If price fails to hold above $0.515, the next area of interest becomes $0.379, then $0.318, and $0.266, marking the levels where the channel's structure could be retested from below.
RSI sits at 72.27, a reading that reflects the strength behind this advance while also placing $ETHFI inside overbought territory right at resistance.
That combination often produces hesitation near a ceiling like $0.515, and the next few sessions carry real weight for this setup.
Data source: TradingView
$ETHFI Price Prediction: Bull, Neutral and Bear Scenarios
Bullish Case | A sustained break and hold above $0.515 keeps the multi-month ascending channel intact and opens the path toward $0.635, with $0.803 as the next level further out. |
Neutral Case | $Ether.fi churns just below $0.515 while the overbought RSI reading cools off, with buyers and sellers testing the resistance zone without a clean resolution. |
Bearish Case | A rejection from $0.515 sends the price back through the channel toward $0.379, then $0.318 and $0.266 as the levels to watch on the way down. |
How Has Ether.fi Performed Recently?
As per the Coinglass data, $Ether.fi is up 0.75% over the past 4 hours and 8.42% over 24 hours, extending a 33.47% weekly gain.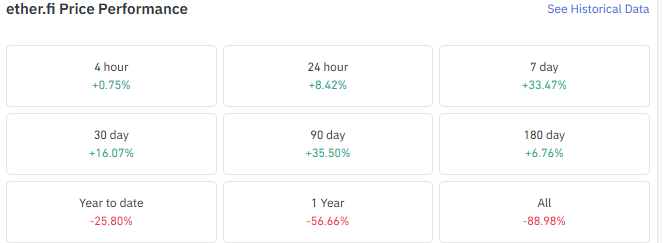
The token has added 16.07% over 30 days and 35.50% over 90 days, though it remains up a more modest 6.76% over the past six months.
Longer term, $Ether.fi is still down 25.80% year to date, 56.66% over the past year, and 88.98% since inception, underscoring how significant this recovery attempt is against the broader downtrend.
What We're Watching Next
As per the CoinGabbar analyst, the setup at $0.515 is the clearest technical signal on the chart right now, and the coming sessions should clarify whether buyers can convert months of base building into a genuine breakout.
As earlier coverage of why Ether.fi dropped despite a similar spike showed, sharp moves in this token have not always held, so confirmation above resistance matters more here than the move itself.
Disclaimer: This article is for informational purposes only and should not be considered financial or investment advice. Cryptocurrency markets are highly volatile, and prices can move sharply in either direction. Readers should conduct their own research and consult a qualified financial advisor before making any investment decisions.
Also read:













.webp)








