Pi Network Price Prediction: PI Faces a Make-or-Break Moment


Pi Network is trading at $0.09193 right now, up 0.9% over the last day, after a sharp drop from above $0.14 back in early June that's kept the coin range-bound in the $0.08–$0.10 zone for weeks.
Daily trading volume is fairly thin at $11.287 million, so the price can swing quickly without much resistance behind it.
This Pi Network price prediction looks at where Pi could head next. If buyers step back in, the price has room to climb higher.
If sellers stay in control instead, expect another leg down toward lower support.
For now, PI is holding steady in a tight range, waiting on a clear push in either direction.
$PI Price Today And Market Snapshot
The Pi coin price today sits at $0.09193, inside a tight 24-hour range of $0.08957 to $0.09323. Market cap is $1.006 billion on a circulating supply of 10.942 billion PI.
Fully diluted valuation comes in higher at $1.548 billion. 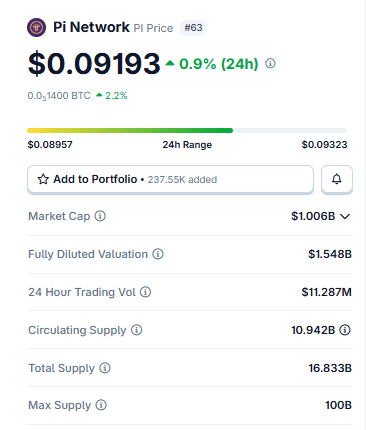
Source: Data Taken From Coingecko, data as of July 23, 2026. Figures may vary slightly across other tracking websites
That gap reflects the difference between circulating and total supply: 16.833 billion $PI issued so far out of a 100 billion max supply cap. 24-hour trading volume is fairly light at $11.287 million.
Worth keeping in mind: thinner volume means moves can happen fast, in either direction, without much resistance behind them.
$PI Social Sentiment And News
On the social side, Pi-Network News today includes some community discussion around the network's Federated Byzantine Agreement consensus design, with accounts breaking down how it compares to standard BFT protocols.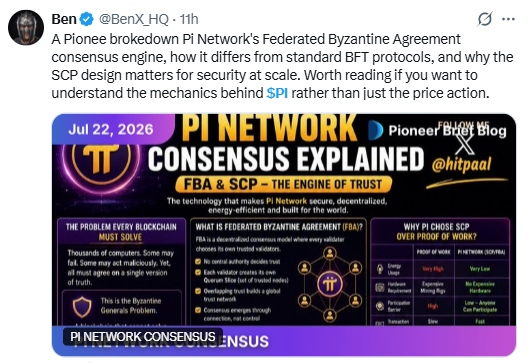
Source: Data Taken From @BenX_HQ, X Account
Sentiment here reads more technical and educational than price-driven; traders are mostly focused on the triangle and the trendline rather than reacting to any single headline right now.
$Pi Network Holder Concentration
Holder data tracked for Pi Network shows a notably concentrated distribution on the tracked contract, with just 8 unique addresses holding a combined 500,000,000 PI.
Of that, a single wallet holds 494,604,514 $PI, which works out to roughly 98.9% of the tracked total. 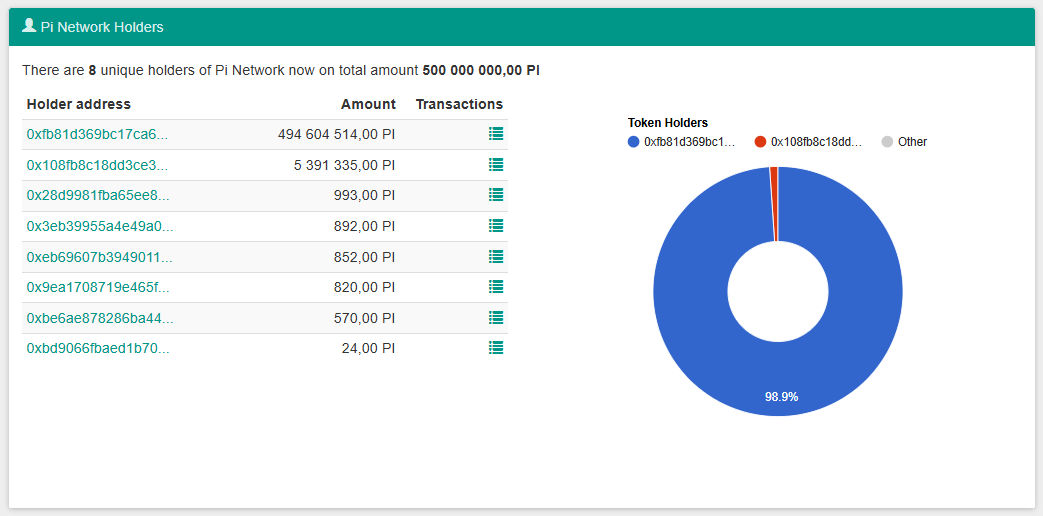
Source: Holder Data Taken From Bloxy.
The second-largest address holds 5,391,335 PI, and the remaining six wallets hold small four-figure amounts each.
One thing to be precise about: this holder concentration snapshot covers a specific tracked pool of 500 million PI, not Pi Network's full 10.942 billion circulating supply.
It shouldn't be read as a statement about the entire network's decentralization.
But within that tracked set, the concentration is extreme, and that kind of imbalance is generally worth flagging as a risk factor for anyone sizing a position, since a small number of wallets can meaningfully move price if they choose to act.
How PI Compares To Other Layer-1 And Mobile-Mined Tokens
| Token | 24H Change | Setup |
|---|---|---|
| Pi Network (PI) | +0.9% | Symmetrical triangle (4H) + trendline test (1D) |
| Similar Low-Cap L1 Tokens | Mixed | Range-bound near key support |
| Mid-Cap Layer-1s | Mixed | Consolidating below prior highs |
Pi Network 4H Chart: Symmetrical Triangle Meets Wolfe Wave
In the 4-hour timeframe, PI is sitting right on the lower boundary of a symmetrical triangle, coiled between rising support and falling resistance since the swing high near $0.10202.
Price is currently trading at $0.09191, basically touching that lower trendline. 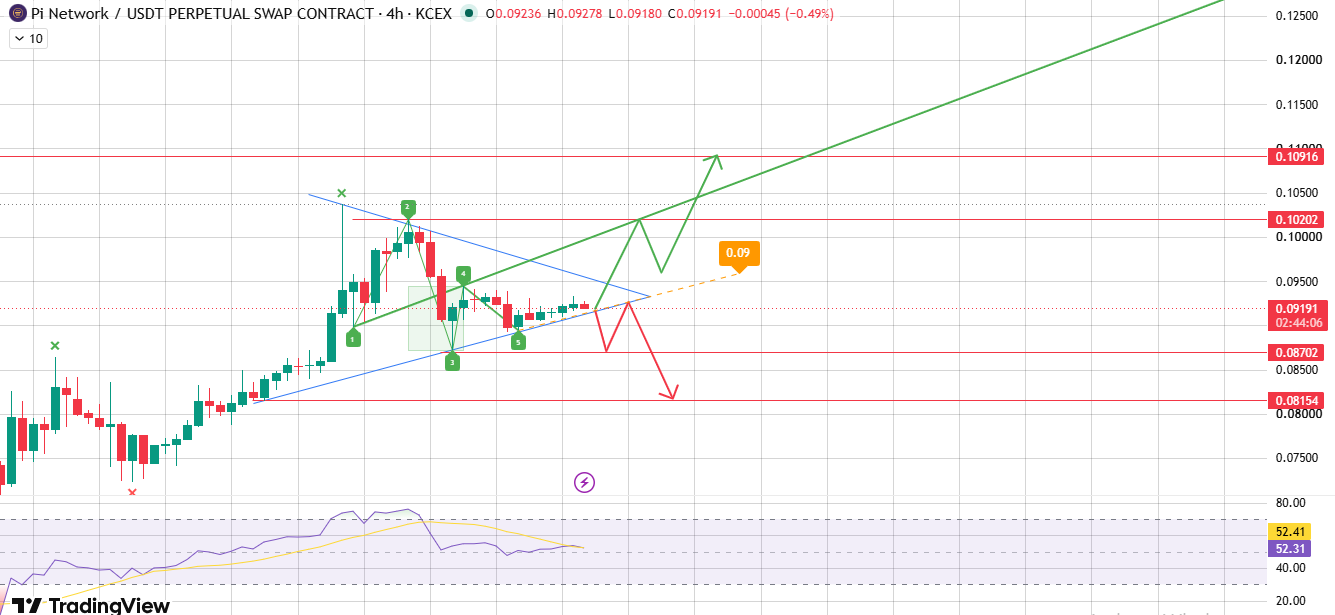
Source: Chart Taken From TradingView at 23.07.2026
If it holds here, the setup lines up with a broader Wolfe Wave pattern marked on the chart (points 1 through 5), which projects price making a run toward the $0.09 zone first and then extending further if momentum carries through.
If instead the price keeps printing lower highs on every bounce without reclaiming the upper trendline, that structure starts to look more like a descending channel than a clean triangle, and that would tilt the near-term bias bearish.
The near-term resistance level sits at $0.10202, with $0.10916 above that as the next hurdle if the bullish breakout actually gets confirmed.
On the downside, if the triangle support at $0.09180 fails, $0.08702 is the first level to watch. $0.08154 sits below that as the deeper support zone.
RSI on the 4H is at 52.31, and the moving average line is at 52.41, basically sitting right on the midline.
Momentum isn't leaning hard either way yet. It's waiting for the triangle to resolve before it commits.
Pi Network 1D Chart: Trendline Support And The $0.11 Wolfe Wave Target
Zoom out to the daily chart, and PI has been respecting an ascending trendline support since the recent swing low near $0.077.
That trendline is currently running just under the $0.0910–$0.0920 zone, right around where price is sitting now. 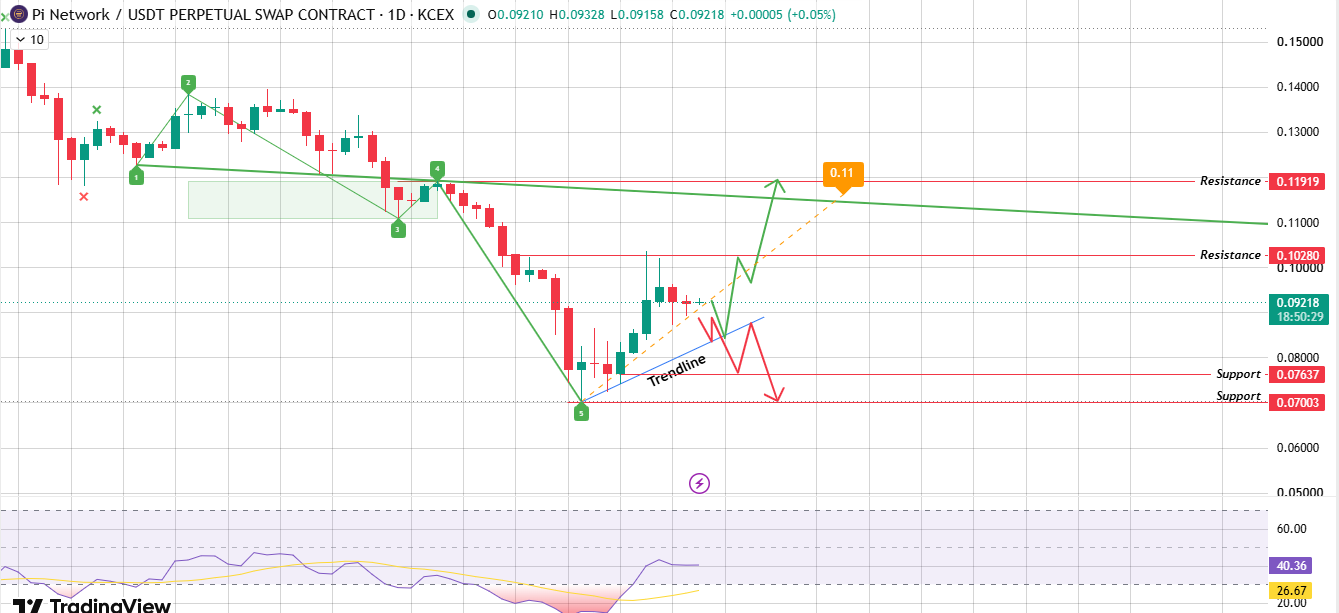
Source: Chart Taken From TradingView at 23.07.2026
The daily chart also carries a Wolfe Wave pattern (again marked with points 1 through 5), and this one projects a more ambitious target: roughly $0.11, which lines up closely with the $0.11919 resistance level plotted on the chart.
If the trendline holds as support, the path toward that $0.11 price target stays open, with $0.10280 acting as an interim resistance level along the way.
If it breaks instead, that would be a confirmed bearish breakdown setup. Price would be expected to fall back toward the $0.07637 support zone, maybe down to $0.07003 if that doesn't hold either.
Daily RSI is at 40.36, a signal at 26.67, below the neutral 50 line but showing early signs of curling up off a recent low. Feels similar to a market stabilizing after a selloff rather than one still actively breaking down.
$PI Price Prediction: Bull, Base, And Bear Scenarios
| Scenario | Trigger | Near-Term Target | Extended Target |
|---|---|---|---|
| Bull | 1D trendline holds; 4H triangle breaks upward with strong volume. | $0.10202 | $0.10916 $0.11919 (Wolfe Wave $0.11 zone) |
| Base | Price stays boxed inside the 4H triangle between $0.0870 and $0.1020. | Range-bound chop | RSI hovers near 50 before resolving. |
| Bear | 1D trendline breaks; 4H triangle support at $0.09180 fails. | $0.08702 $0.08154 | $0.07637 $0.07003 |
A pi network price prediction that only looks at the bullish Wolfe Wave target without weighing the trendline-break scenario is missing half the picture. Both patterns are pointing to a real move; the direction just isn't locked in yet.
Final Outlook: Is Pi Network Going To Go Up?
So where does that leave things? PI is sitting at a real decision point on both the 4H and 1D charts at the same time, which doesn't happen every day.
The symmetrical triangle on the 4H and the trendline support on the 1D are both being tested right now.
The Wolfe Wave projections on each timeframe are pointing to meaningfully higher levels if support holds: $0.09 near-term on the 4H and closer to $0.11 on the 1D.
Like most alt-majors, PI doesn't move in a vacuum. Broader BTC dominance shifts and ETH correlation across the market tend to set how much room lower-cap tokens actually get to run once a pattern like this resolves.
If Bitcoin stays steady, PI's setup is more likely to play out cleanly along its own technical levels.
If BTC gets volatile, expect PI's triangle and trendline to resolve faster and with more noise than the clean lines on the chart suggest.
The levels that matter most right now are $0.09180–$0.09191 as the immediate pivot and $0.10202 and $0.10916 on the upside and $0.08702 and $0.08154 on the downside if things break the other way.
Whether this pi coin price prediction plays out bullish comes down to whether buyers defend both the triangle and the trendline over the next few sessions, not to any single headline or Wolfe Wave marking on its own.
Quick Glossary
A symmetrical triangle is a squeeze pattern, with lower highs on one side and higher lows on the other, with both lines meeting at a point where price usually makes a decisive move.
A Wolfe Wave pattern is a five-point structure traders use to project a price target based on the symmetry of prior swings; it's less about the shape and more about where those swings suggest price is heading next.
Trendline support is a rising line drawn under a series of higher lows, used to judge whether buyers are still stepping in on dips.
And RSI, or Relative Strength Index, is a 0–100 momentum gauge; above 70 usually means overbought, below 30 usually means oversold, and anywhere near 50 just means the market hasn't picked a side yet.
A Quick Note On How This Was Put Together
Every level referenced here, including triangle boundaries, trendline zones, and Wolfe Wave targets came directly off the 1D and 4H charts reviewed while writing this. Nothing was extrapolated beyond what the charts actually show.
Holder data reflects a specific tracked contract snapshot rather than the full network supply, and that distinction is called out above rather than glossed over.
Price, market cap, and supply figures are a snapshot from July 23, 2026, so some numbers may have moved by the time you're reading this. Check a live chart before acting on anything here.
Disclaimer: This article is for informational purposes only and is not financial advice. Cryptocurrency markets are volatile; do your own research before investing.
Also read:

















