Cardano Price Prediction: Can ADA Break Out 56% Higher?


Cardano has spent the past few weeks stuck in a corrective slide, but something is starting to shift beneath the surface.
On-chain activity is picking up even as price lags, and that gap between usage and valuation is exactly the kind of setup that gets traders watching closely for a turn.
This Cardano price prediction looks at whether ADA finally has what it takes to break out of the pattern that has capped it for weeks.
Nothing here is financial advice, and everything below is based on a 4-hour ADA/USDT perpetual chart, so it's meant as a short-term to medium-term read, not a long-range call.
What the Market Numbers Say About ADA
Cardano is currently priced at $0.1758, up 1.27% over the past 24 hours.
Futures volume over that window came in at $312.61M, well above the $35.19M in spot volume, so most of the near-term price action is being driven by leveraged traders rather than spot buyers.
Open interest, the total dollar value of futures and perpetual positions still open on exchanges, sits at $472.13M.
Market cap stands at $6.41B against a circulating supply of 36.55B ADA, out of a total supply of 44.99B and a max supply of 45.00B, meaning nearly all of Cardano's eventual coin supply already exists.
Source: CoinGlass, August 19, 2026.
How These Levels Were Worked Out
Everything technical in this Cardano price outlook comes from a 4-hour ADA/USDT perpetual chart on Binance, read through TradingView.
The falling channel and its boundaries are marked directly on that chart, and the levels above and below it come from where price has previously reacted.
Because this is a 4-hour timeframe, think of the read as covering the next several days rather than the next few hours, and it's worth rechecking if ADA closes clearly outside the 0.1381 to 0.2747 range this article covers.
Cardano's Usage Is Climbing Even As Price Lags
Here's the part of this ADA technical analysis that doesn't show up on a candlestick chart.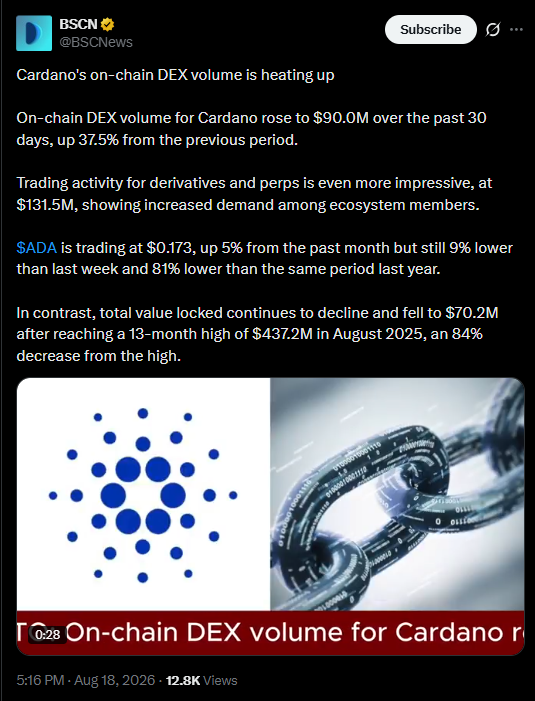
On-chain DEX volume for Cardano rose to $90.0M over the past 30 days, a 37.5% jump from the previous 30-day period, and derivatives and perps activity across the ecosystem came in even stronger at $131.5M. That's meaningfully rising usage.
Price, meanwhile, tells a different story. ADA has gained about 5% over the past month but is still down 9% week over week and sitting roughly 81% below where it traded this time last year.
Total value locked has also kept sliding, falling to $70.2M after peaking at a 13-month high of $437.2M back in August 2025, an 84% drop from that high.
Rising activity paired with a weak price and shrinking TVL is a mixed signal at best, not a clean bullish story, and it's worth keeping that tension in mind rather than reading the volume number in isolation.
Source: @BSCNews on X, August 18, 2026, 5:16 PM IST.
ADA Liquidation Flows Over the Last 24 Hours
Liquidation data leans toward longs bearing the brunt of recent pain.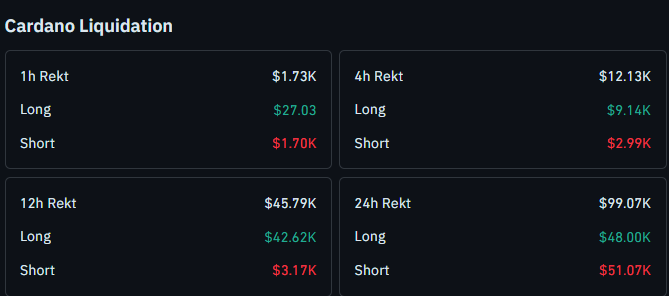
In the past hour, total liquidations were tiny at $1.73K, split $27.03 long versus $1.70K short.
Zoom out to four hours, and long-side liquidations pull ahead at $9.14K against a $2.99K short, out of $12.13K total.
The 12-hour window shows a much wider gap, $42.62K in long-side liquidations against just $3.17K short, out of $45.79K total.
Across the full 24 hours, long-side liquidations hit $48.00K versus $51.07K short-side, out of $99.07K total, a window where shorts actually edged ahead slightly.
Put together, the middle stretch of the day saw leveraged longs taking the bigger hit as ADA dipped, which lines up with a market that's been more comfortable fading strength than chasing it lately.
Source: CoinGlass, Cardano liquidation data, August 19, 2026.
Who Actually Holds the ADA Right Now?
Holder concentration data adds a useful wrinkle to this Cardano price forecast.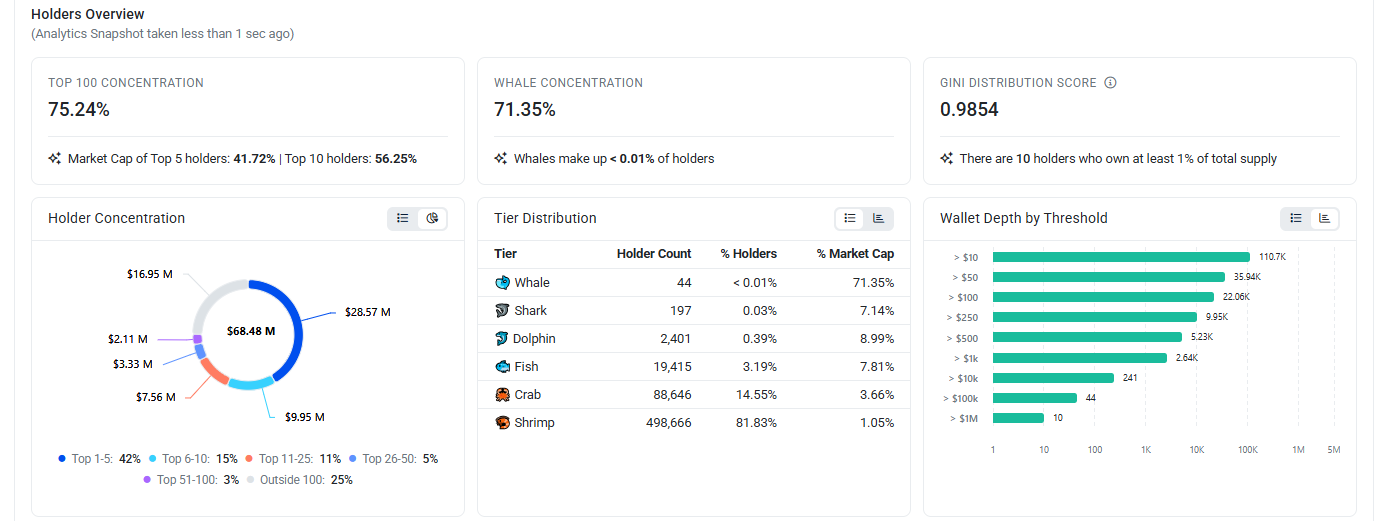
The top 100 wallets control 75.24% of supply, and the tier CoinGlass classifies as whales, just 44 wallets, or under 0.01% of all holders, account for 71.35% of market cap.
The top 5 holders alone represent 41.72%, and the top 10 make up 56.25%. The Gini score, which measures how unevenly a supply is distributed on a scale toward 1, sits at 0.9854, among the more concentrated readings you'll see.
There's a catch worth mentioning here though. Looking at the actual top ten addresses, most of them are labeled exchange wallets, several Binance hot wallets among them, rather than single private holders.
That changes the read a bit. High concentration in exchange custody wallets usually reflects user deposits pooled together, not one entity with outsized control over price, so this isn't quite the same risk signal that concentrated whale wallets on other chains might carry.
Source: on-chain holder analytics, holder snapshot taken roughly 7 hours before this piece was compiled, August 19, 2026.
Where ADA Stands Right Now
CMP: $0.1756 (Binance ADA/USDT perpetual, 4h chart)
24h change: +1.27% (per CoinGlass)
Setup: attempting to break out of a falling channel
Bullish trigger: close above 0.1810 and hold it
Bullish targets: 0.2117, then 0.2747
Bearish trigger: rejection at 0.1810 followed by a close below 0.1532
Bearish target: 0.1381
Chart source: TradingView, ADA/USDT perpetual, 4h, Binance, captured August 19, 2026, 12:16 PM IST (6:46 AM UTC)
One thing worth flagging early: ADA has been rejected from this channel's upper boundary before, so a single wick above 0.1810 without a proper close and hold doesn't confirm anything on its own.
Leverage around this zone has already been punishing on both sides, so treat these levels as a map, not a guarantee.
Key Takeaways
ADA is testing the top of a falling channel on the 4-hour chart, a level it hasn't managed to close above yet.
A confirmed close and hold above 0.1810 would put 0.2117 in focus 0.2117 and, further out, 0.2747.
Losing 0.1532 flips the picture bearish, with 0.1381 as the next stop.
On-chain DEX volume for Cardano jumped 37.5% over the past 30 days even as ADA's price stayed weak.
Long-side liquidations have dominated the past 12 and 24 hours, hinting that leveraged bulls have been getting squeezed on the way down.
Can ADA Actually Clear This Falling Channel?
Right now ADA is pressing against the upper boundary of a falling channel on the 4-hour chart, and whether it can close above 0.1810 and hold there is the single biggest question hanging over this setup.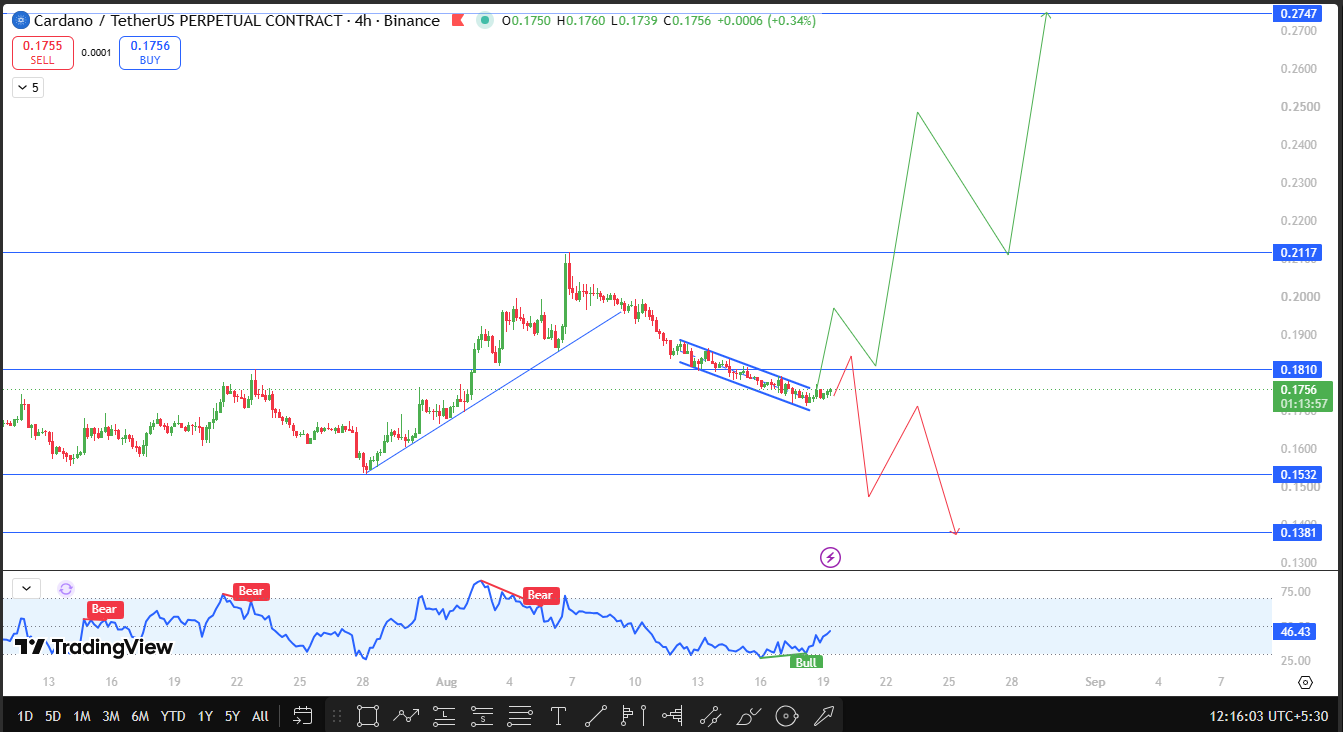
The channel itself has been intact for a couple of weeks, with price making lower highs and lower lows inside two parallel descending trendlines.
What's changed recently is that ADA has stopped making fresh lows and is now pushing directly into the upper boundary, which is often the first sign that sellers are starting to lose control, though it isn't proof on its own.
The chart's momentum reading currently sits at 46.43, just below the neutral midpoint, after printing a run of bearish divergence tags through late July and early August and a bullish tag showing up more recently near the current price.
That shift in tone on the oscillator lines up with the price action tightening into this breakout attempt.
Should ADA manage a close above 0.1810 and stay there, the next resistance to watch is 0.2117, and a stronger continuation could stretch things toward 0.2747.
If instead 0.1810 holds as resistance and the price rolls over, a close below 0.1532 would undo the recovery attempt and put 0.1381 back in play as support.
Technical Snapshot at a Glance
Indicator | Signal |
Structure | Falling channel, price testing the upper boundary |
Momentum reading | 46.43, near neutral, recent shift from bearish to bullish tags |
Bias above 0.1810 (confirmed) | Bullish, targets 0.2117 and 0.2747 |
Bias below 0.1532 (confirmed) | Bearish, targets 0.1381 |
ADA Support and Resistance Zones
Type | Level | Note | % From CMP |
Resistance 2 | 0.2747 | Extended target on a strong breakout | +56.44% |
Resistance 1 | 0.2117 | First target after clearing the channel | +20.56% |
Channel Resistance | 0.1810 | Must close above and hold | +3.08% |
Support Confirmation | 0.1532 | Close below undoes the bullish attempt | -12.76% |
Support 1 | 0.1381 | Next support if breakdown confirms | -21.35% |
Risk-Reward Snapshot
Case | Trigger | Target |
Bull Case | Confirmed close and hold above 0.1810 | 0.2117, then 0.2747 |
Bear Case | Rejection at 0.1810, close below 0.1532 | 0.1381 |
Invalidation Level: The bullish read on this ADA price outlook breaks down on a confirmed close below 0.1532, which would point back toward 0.1381.
What Could Flip This Outlook
A daily-style close that holds above 0.1810, especially if it comes with rising spot volume rather than just futures activity, would strengthen the case for a real channel breakout.
On the flip side, another rejection here followed by a decisive break of 0.1532, particularly alongside a fresh wave of long-side liquidations, would tilt the balance back toward the downside scenario.
Does Bitcoin's Mood Still Matter for ADA?
Cardano still trades largely in sync with the broader market, and Bitcoin's direction tends to set the ceiling or floor for how far altcoin moves like this one can run.
A steady or rising Bitcoin gives ADA more room to actually clear 0.1810 and hold it, while a risk-off shift in Bitcoin could cap the attempt even if ADA's own chart looks constructive.
When This Cardano Price Prediction Gets a Second Look
Worth revisiting if ADA closes clearly above 0.2117 or below 0.1532 within the next few days, since either move would settle which direction the channel actually resolves in.
Until one of those closes happens, the 0.1810 boundary is the level that matters most.
Glossary
CMP: Current Market Price, the price ADA is trading at when this was written.
Open Interest: The total dollar value of futures and perpetual contracts still open across exchanges.
Liquidation: When an exchange force-closes a leveraged position because losses have eaten through the trader's margin.
Falling Channel: A price structure bound by two parallel downward-sloping trendlines, often watched for a breakout once price nears the upper line.
Gini Score: A concentration measure for token holders, where a score closer to 1 means supply is held by fewer wallets.
Bull, Base, and Bear Case for ADA
Bull Case: Price closes above 0.1810 and holds it, confirming the channel breakout, then works toward 0.2117 with 0.2747 as the stretch target if momentum carries through.
Base Case: Price keeps chopping between 0.1532 and 0.1810 without a decisive close on either side, mirroring the tug-of-war between rising on-chain activity and weak price action.
Bear Case: Price gets rejected again at 0.1810, breaks down through 0.1532, and slides toward 0.1381 as the channel's bearish structure reasserts itself.
Disclaimer
This article is for informational purposes only and does not constitute financial advice. Cryptocurrency markets, including perpetual futures, are highly volatile, and leveraged trading carries a real risk of loss. CoinGabbar and the analyst do not hold a position at the time of publication. Readers should do their own research before making any investment decisions.







.webp)








