Cardano Price Prediction: $ADA Could Explode After $0.20


Cardano's had one job this year: get above $0.20. Every single time it got close, something knocked it back down.
Today, it just... didn't. ADA cleared the level and is holding there, up over 6%. So is this the real breakout everyone's been waiting for?
The shorter-term chart shows price catching its breath right under a new resistance pocket, which usually means a bit more chop before anything gets confirmed. But the bigger daily trend hasn't changed; it's still pointed up.
This Cardano price prediction leans toward continuation, but clearing $0.20 was the easy part, honestly. What happens at the next resistance band is where this actually gets tested.
Live Market Data
$ADA is currently trading at $0.1997 and up 6.6% on the day.
The 24-hour range ran from $0.1872 all the way to $0.211, a wider swing than this token's seen in a while. 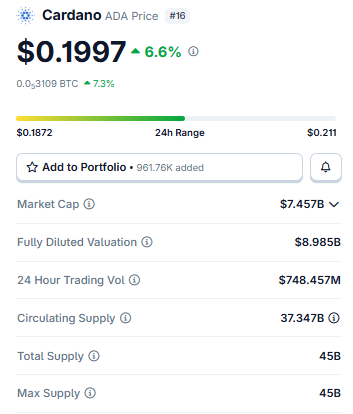
Source: $ADA Market Cap Data Taken From Coingecko, data as of Aug 07, 2026. Figures may vary slightly across other tracking websites.
Market cap comes in at $7.457B, with a fully diluted valuation just under $9B at $8.985B. Supply-wise, there's not much drama, with 37.347B circulating out of a hard 45B cap on both total and max supply.
Nothing left to unlock, nothing to dilute. Trading volume over the past 24 hours landed at $748.457M.
Liquidation Data
The liquidation heatmap is worth a second look. Total damage over 24 hours ran $3.77M, and $3.19M of that hit shorts specifically. Whoever was betting against this move got caught, badly.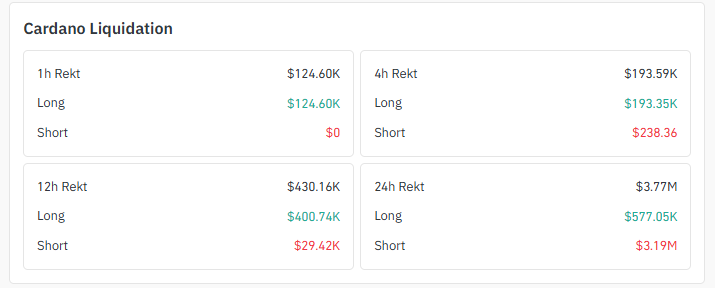
Source: Liquidation Data Taken From Coinglass.
Shorten the window, though, and the story flips. For the past 4 hours, longs actually took the bigger hit, with $193.35K wiped out compared to just $238.36 on shorts, practically nothing.
And in the last hour alone, every dollar liquidated, all $124.60K, came from longs. So the big short squeeze already happened.
Now it's the late-arriving longs chasing the pump who are starting to feel it on any dip.
Exchange Volume
Where's this all trading? Mostly the usual names. Binance's out front at $54.90M over 24 hours, and Coinbase is not far behind at $44.77M. 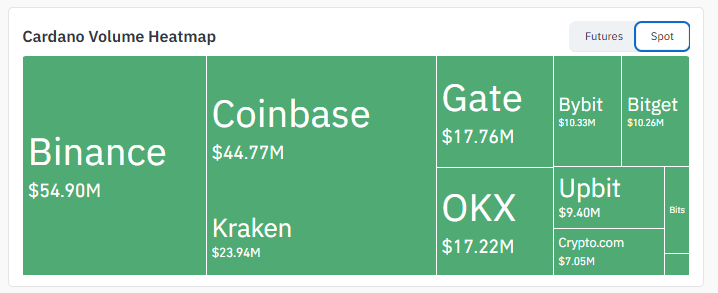
Source: Liquidation Data Taken From Coinglass.
Kraken pulls in $23.94M, Gate and OKX are neck and neck around $17-18M each, and Bybit, Bitget, Upbit, and Crypto.com fill in the rest somewhere between $7M and $10.3M apiece.
Spread this evenly across exchanges; this isn't some pump confined to one platform, and that tends to matter for how long a move actually sticks.
Social Sentiment of Cardano Ada
There's more going on than just the chart. Cardano's shifting into what's being branded its Dijkstra development era, a newly approved roadmap letting the network fund core development straight out of its own community treasury. 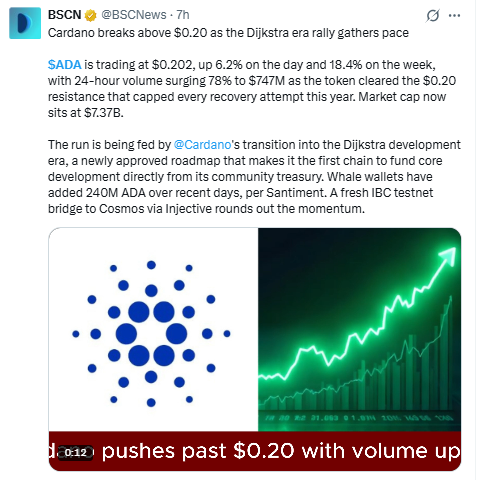
Source: Data Taken From @BSCNews , X Account
That kind of structural news tends to draw fresh eyes. Add to it reports of whale wallets adding roughly 240 million $ADA over the past several days.
According to on-chain data from Santiment, plus a new IBC testnet bridge linking Cardano to Cosmos via Injective, you've got more than just a technical bounce here.
There's a real narrative running underneath it.
Key Takeaways
-
ADA sits near $0.1997, up 6.6% today, after finally breaking a $0.20 ceiling that turned back every rally attempt this year.
-
Near-term levels point to $0.2048 first and $0.2117 after that, assuming buyers don't run out of steam.
-
Zoom out to the daily chart and ADA's riding an ascending channel, with the top of that channel opening a path to $0.2389 and eventually $0.2826.
-
Whale wallets picked up around 240 million ADA over the past few days, per on-chain trackers.
-
Shorts got hammered in the last 24 hours; $3.19M liquidated there against a comparatively tame $577.05K on the long side.
Technical Analysis for Cardano Price Prediction
Short-Term Chart Analysis
Zooming in the 30-minute chart , here's what jumps out: a classic setup, honestly, a symmetrical triangle, rising support pressing into falling resistance, getting tighter with each candle.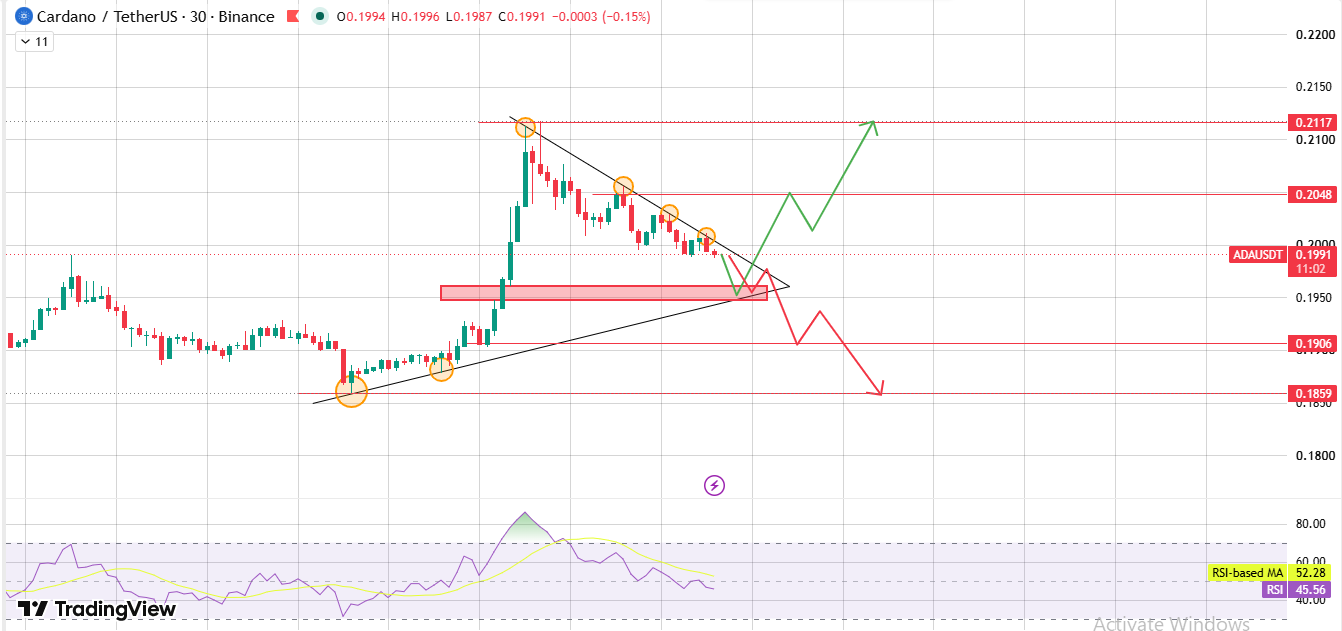
Source: Chart Taken From TradingView.
Break above it, and $0.2048 is the first thing in the way, with $0.2117 sitting just past that if momentum carries through.
Fail to hold, though, and there's a real shot at a bearish breakdown toward $0.1906, maybe deeper to $0.1859 if sellers get aggressive.
RSI here reads 45.56 against a 52.28 moving average. Basically a coin flip at this timeframe; nothing's decided yet.
Daily Chart Analysis
Here's where it gets more compelling. On the daily, ADA's been grinding higher inside an ascending channel for weeks now, higher lows, higher highs, the whole textbook pattern. 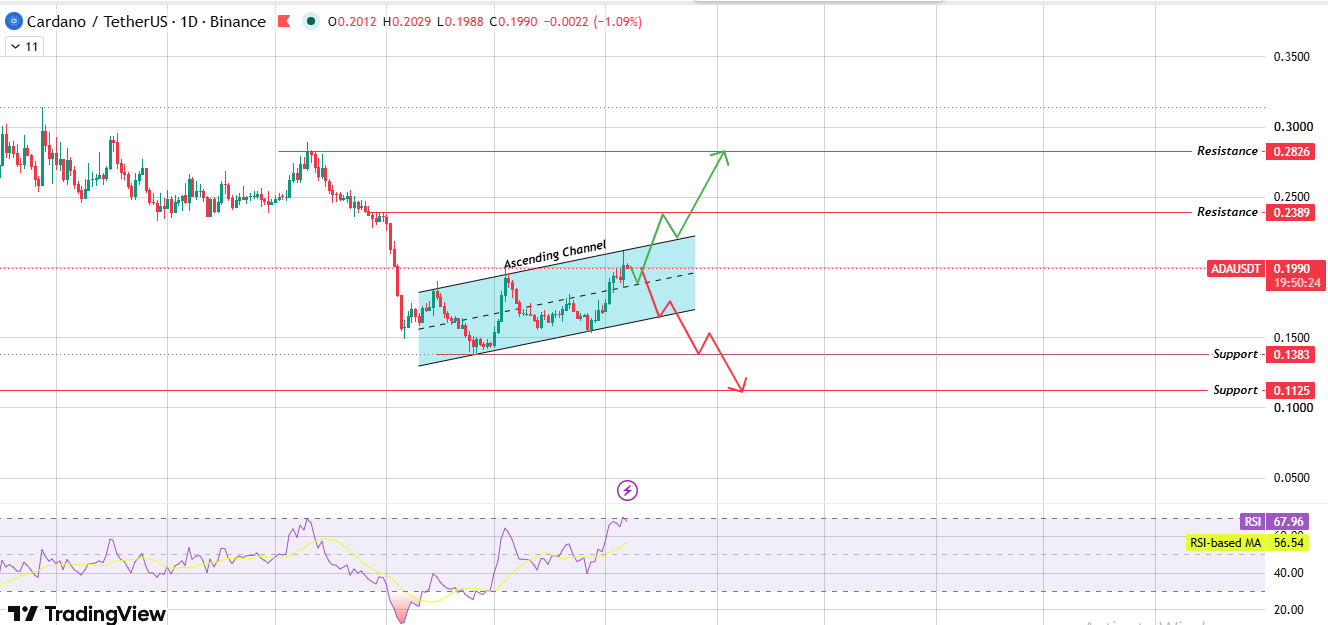
Source: Chart Taken From TradingView.
Price is knocking on the upper rail of that channel as we speak.
Clear it and $0.2389 becomes the next real resistance level, with $0.2826 waiting further out if this thing has legs.
Lose that channel instead, and the floor matters a lot more. A drop back down puts $0.1383 in focus as a key support zone and $0.1125 underneath that in a worse-case scenario.
RSI on this timeframe is sitting hot at 67.96, well clear of its 56.54 average. Buyers have been running the show here for a while; that much is obvious.
Bull, Base, and Bear Scenarios
Different timeframes, but they're basically saying the same thing. Hold $0.195, and the path up stays open. Break it, and both charts start agreeing on the way down too.
Risks
Nothing trades in a bubble, ADA included. A swing in BTC dominance, or a sudden crack in ETH correlation, could easily override whatever this chart is saying.
Worth remembering before treating any single level as a sure thing.
And triangle setups like the one forming short-term have a nasty habit of faking traders out right before the real move shows up.
Volume confirmation matters more than the first candle through any line.
Glossary
Ascending Channel: A chart pattern marked by parallel rising trendlines, where price moves between a higher-low support line and a higher-high resistance line.
Symmetrical Triangle: A consolidation pattern where a rising support line and a falling resistance line converge toward a single point, often preceding a breakout.
Liquidation Heatmap: A visual or data summary showing where leveraged long and short positions were forcibly closed due to price movement.
Support Zone: A price area where buying interest has historically been strong enough to halt or reverse a decline.
Methodology: Levels referenced in this Cardano price prediction come straight from TradingView chart analysis on the 30-minute and 1D timeframes, alongside liquidation, volume, and market data pulled from Coinglass and exchange data aggregators at the time of writing. Figures can shift as market conditions do.
Disclaimer: This article is for informational purposes only and does not constitute financial advice. Cryptocurrency markets are highly volatile and speculative. Estimated probabilities reflect technical analysis of chart patterns, not certainty. Always conduct independent research and consult a licensed financial advisor before making investment decisions.
















