Cardano Price Prediction: Can ADA Push Toward $0.2885?


ADA has been quietly building strength on the 4-hour chart, riding an ascending trendline and stamping out a fresh higher high before slipping into a tighter, more cautious range.
Right now, price is boxed inside a falling channel, and how it exits this squeeze could set the tone for the next big leg.
The levels in this Cardano price prediction come from the 4-hour CardanoUSDT chart and should be rechecked if the price closes meaningfully outside the stated range.
Cardano Price Right Now: Live Market Snapshot
Metric | Value |
Price | $0.1771 (CoinGlass: $0.1768, -0.11%) |
24h Futures Volume | $289.83M |
24h Spot Volume | $36.65M |
Market Cap | $6.47B |
Open Interest | $456.98M |
Circulating Supply | 36.55B |
Total Supply | 44.99B |
Max Supply | 45.00B |
Open interest reflects the total value of ADA futures contracts still open in the market, and a reading close to $457M shows leveraged traders remain actively positioned around this channel.
Data as of Aug 17, 2026, 11:13 IST (05:43 UTC).
Chart source: Cardano/TetherUS Perpetual, 4H timeframe, Binance via TradingView, captured Aug 17, 2026, 11:13 IST.
Methodology and Data Sources: Price and volume data sourced from CoinGlass, liquidation figures from CoinGlass, and historical price performance data from CoinGlass.
Cardano Price Performance: How $ADA Has Moved Across Timeframes
Zooming out gives helpful context for this Cardano price prediction today. 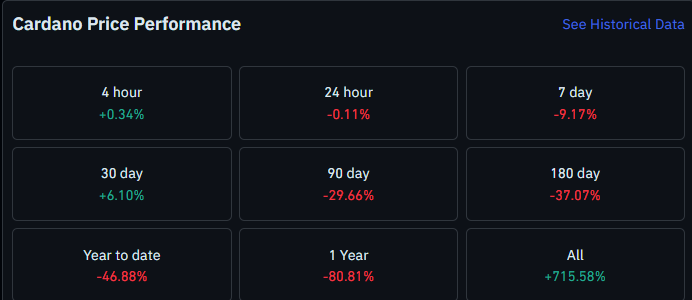 ADA is up 0.34% over the last 4 hours but down 0.11% on the day.
The 7-day change sits at negative 9.17%, and the 30-day change is positive 6.10%, showing choppy short-term action layered on top of a longer downtrend.
Over 90 days, ADA is down 29.66%; over 180 days, it is down 37.07%; and year-to-date, it is down 46.88%.
The 1-year figure sits at negative 80.81%, though the all-time change remains a striking positive 715.58%, a reminder of how far ADA has come since its earliest cycles even after this drawn-out slide.
Source: CoinGlass, Aug 17, 2026.
Liquidation Snapshot: Who Is Getting Squeezed Right Now
The liquidation data leans bearish for leveraged bulls in the near term. 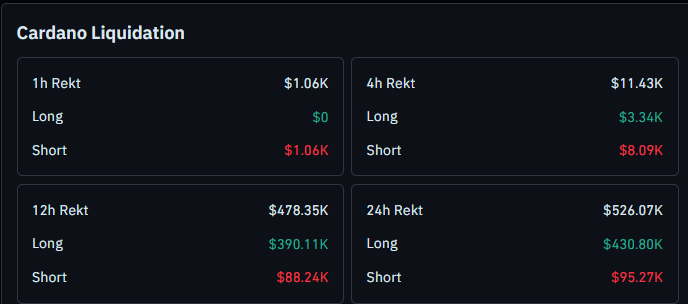 Over the past hour, $1.06K was wiped out entirely from short positions with zero long liquidations.
But stretch the window to 12 hours, and the picture flips hard, with $390.11K in long liquidations against just $88.24K in shorts, out of a total $478.35K rekt.
The 24-hour figure tells the same story, $430.80K in longs liquidated versus $95.27K in shorts, out of $526.07K total.
This suggests traders betting on an ADA breakout have been getting caught out more than those positioned short.
Source: CoinGlass Liquidation data, Aug 17, 2026, 11:13 IST.
Trend and Momentum: Key Takeaways
ADA trades near $0.1771, inside a falling channel after printing a fresh higher high
A breakout above the channel needs to hold near $0.2117 to stay valid
The first resistance on a confirmed breakout sits at $0.2322, the next major resistance at $0.2885
A breakdown could see ADA lean on the ascending trendline for support before revisiting similar levels
A close below $0.1532 would invalidate the bullish structure, opening the door to $0.1381
Long liquidations are outpacing shorts over the past 12 and 24 hours, showing bulls have been the ones under pressure lately
Breakout and breakdown zones like this always carry the risk of false moves and quick liquidity sweeps, especially with leveraged ADA positions active on both sides of the channel.
Treat every level here as a zone to watch, not a promise of direction.
ADA Price Prediction: What Does the 4-Hour Chart Show?
ADA followed its ascending trendline on the 4-hour timeframe and used the first retest of that line to carve out fresh higher highs.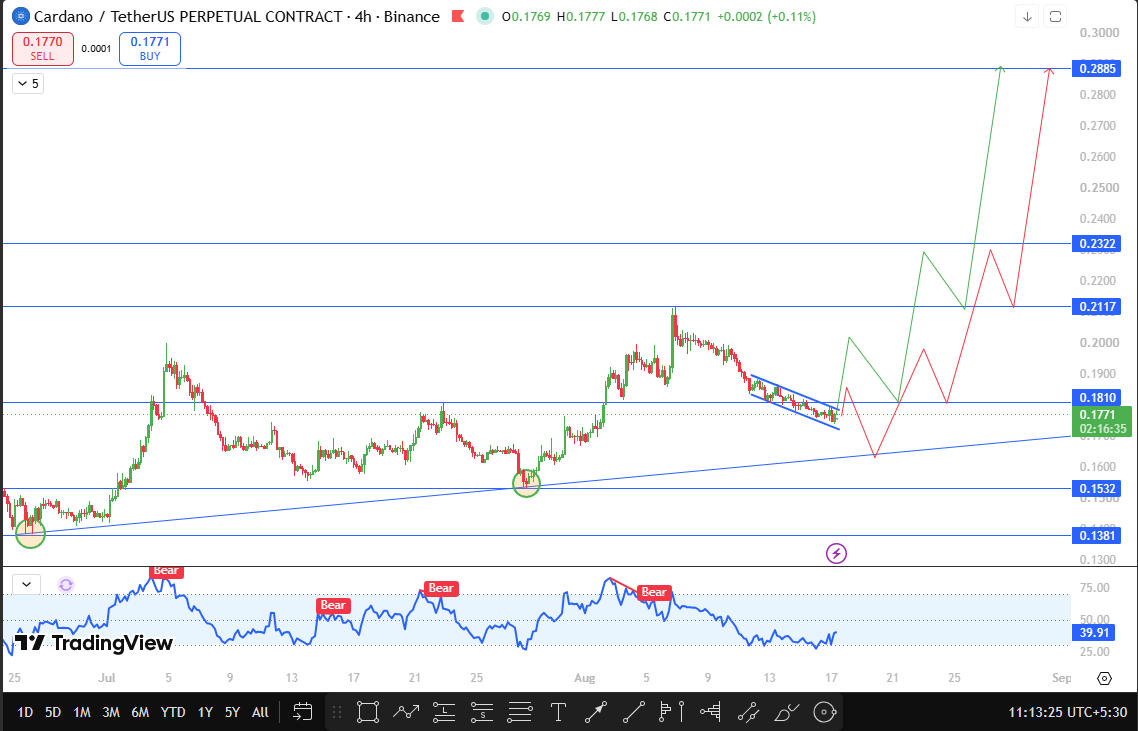
Since then, price has pulled back into a falling channel and is currently trading inside that structure, caught between short-term selling pressure and the broader uptrend still holding underneath.
If ADA manages a breakout from this falling channel and sustains itself near $0.2117, that would open the path toward first resistance at $0.2322.
A strong move beyond that level shifts focus toward the next resistance at $0.2885, a far more ambitious target that would mark a major shift in structure.
On the other hand, if ADA breaks down from the channel, the ascending trendline underneath becomes the next support to watch, and price could use that line to stabilize before potentially working back toward those same upper levels over time.
The bullish structure stays intact as long as ADA holds above $0.1532.
A confirmed close below that level would invalidate this outlook and shift attention toward $0.1381 as the next support.
Technical Outlook Snapshot
Indicator | Signal |
Pattern | Falling channel forming after ascending trendline retest and higher high |
Built-in Oscillator RSI | Bear tag shown on recent candles, reading near 39.91 |
Immediate Bias | Cautious inside the channel until a breakout or breakdown is confirmed |
Support and Resistance Levels to Watch
Type | Level | Note | % From CMP |
Resistance | $0.2885 | Next major resistance on a strong breakout | +62.9% |
Resistance | $0.2322 | First resistance after channel breakout | +31.1% |
Breakout Zone | $0.2117 | Level price needs to sustain above post-breakout | +19.5% |
Support | Ascending trendline | Dynamic support on a channel breakdown | Varies |
Invalidation | $0.1532 | Close below here fails the bullish structure. | -13.5% |
Support | $0.1381 | Next support if $0.1532 breaks | -22.0% |
Scenario Table for This Price Prediction
Case | Trigger | Target |
Bullish | Channel breakout, sustained above $0.2117 | $0.2322, then $0.2885 |
Bearish | Close below $0.1532 | $0.1381 |
What Would Change This Cardano Price Prediction?
Two levels really matter here. If ADA manages a 4-hour close above $0.2117, that alone is enough to put this whole breakout analysis back on the table.
The same goes on the downside; a close below $0.1532 would be reason enough to sit back and rethink the setup.
Beyond price itself, keep an eye on the liquidation numbers too.
If shorts suddenly start taking more damage than longs, that shift alone often says something the chart hasn't caught up to yet.
How Bitcoin Sentiment Could Move ADA
Like most large-cap altcoins, ADA rarely moves in a vacuum.
When Bitcoin turns risk-off, Cardano usually feels it fast, and that kind of pressure could push the price down toward the trendline support sooner than the chart alone would suggest.
On the flip side, a strong Bitcoin run tends to lift ADA along with it, and that could give price the push it needs to clear the falling channel and head toward $0.2117 without much of a fight.
When This ADA Price Prediction Gets Revisited
Nothing here is set in stone. This view gets revisited the moment ADA closes a 4-hour candle outside either $0.2117 or $0.1532. It's also worth another look if the liquidation data flips, meaning longs and shorts swap places in terms of who's getting hurt more.
Glossary
Falling Channel: Think of it as two downward sloping lines running side by side, boxing price in. It usually shows up as a breather within a bigger uptrend rather than a reversal.
Ascending Trendline: A line drawn along a series of rising lows, marking where buyers have consistently stepped back in.
Open Interest: The total dollar value of futures contracts that are still open and haven't been settled yet.
Liquidation: What happens when a leveraged trade gets forcibly closed because losses eat through the required margin.
Bull, Base, and Bear Case for ADA
Bull Case: Price pushes out of the falling channel and holds above $0.2117. From there, $0.2322 becomes the first real test, and if momentum keeps building, $0.2885 comes into play as the bigger target.
Base Case: Price just keeps chopping between roughly $0.1532 and $0.2117 for now, with neither side strong enough to force a clean break in either direction.
Bear Case: Price slips below the ascending trendline and can't hold $0.1532 on a close. That would break the bullish structure and put $0.1381 in focus next.
Disclaimer
Nothing in this piece should be taken as financial advice; it's meant purely for information. Crypto markets can swing hard and fast in either direction, so please do your own homework and talk to a licensed financial advisor before putting real money on the line.
Also read:













.webp)








