Cardano Price Prediction: ADA Eyes $0.2206 After Trendline Break


Cardano price prediction chatter has picked up pace this week, and it is easy to see why. ADA is sitting at a spot on the chart where its recent trendline structure and a regulatory calendar date are lining up at almost the same moment.
The levels discussed below come from the 4-hour ADA/USDT chart on Binance and should be rechecked if the price closes meaningfully outside the range covered in this analysis.
Cardano Trend and Momentum: Key Takeaways
ADA is trading around 0.1969 dollars, up about 0.51% on the 4-hour candle
Price broke its ascending trendline on the fourth retest after making higher highs on each prior touch
A close above 0.1995 opens the door toward 0.2116 and then 0.2206
A close below 0.1859 shifts focus toward 0.1810 as the next support
The chart's built-in oscillator shows a bearish divergence, with two bear tags marking lower highs on momentum even as price pushed higher
Cardano's ETF seasoning window closes today, August 9, with a possible SEC decision window opening around October 23
Please treat these as technical reference points rather than guaranteed outcomes. Crypto markets are volatile, and levels can invalidate quickly on high-volume moves.
Cardano Price Right Now
Metric | Value |
Price | $0.1969 |
24H Change | -1.01% |
Futures Volume (24H) | $348.44M |
Spot Volume (24H) | $44.11M |
Market Cap | $7.16B |
Open Interest | $477.73M |
Circulating Supply | 36.55B ADA |
Total Supply | 44.99B ADA |
Max Supply | 45.00B ADA |
Open interest is the total value of open futures contracts that have not yet been settled, and a reading near 477 million dollars shows there is still meaningful leveraged positioning built up around current prices.
Chart source: TradingView, ADA/USDT 4H, Binance, captured August 10, 2026, 09:52 IST (04:22 UTC). Market data source: CoinGlass, captured August 10, 2026 (approximate same window).
Methodology and Data Sources
This Cardano price prediction is built from a live 4-hour price chart with a hand-marked ascending trendline, plus real-time market data and liquidation. figures pulled from CoinGlass.
No external analyst forecasts or projected price models have been added; the levels reflect only what the chart and data show at capture time.
Cardano ETF Eligibility Date: What Just Happened
Cardano's path toward a possible spot ETF reached a milestone this week.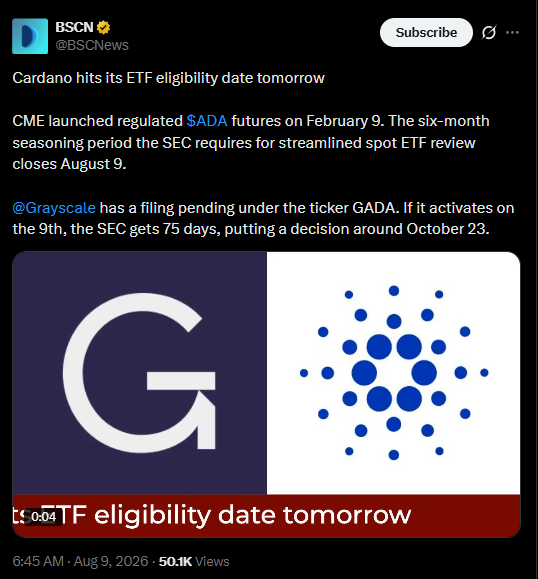
CME launched regulated $ADA futures on February 9, and the SEC's six-month seasoning period tied to that launch closed on August 9.
Grayscale currently has a spot ADA ETF filing pending under the ticker GADA.
If that filing activates following the seasoning period close, the SEC would then have a 75-day review window, which points toward a possible decision date around October 23.
This is a procedural step rather than a confirmed approval, so treat it as a date to watch rather than a guaranteed outcome.
Source: BSCN (@BSCNews) on X, August 9, 2026, 6:45 AM.
Cardano Liquidation Snapshot
Liquidation flow gives a sense of how leveraged traders are getting caught out on both sides.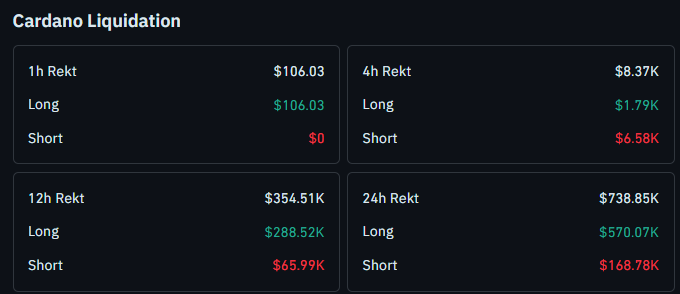
Over the last hour, longs alone accounted for the wipeout with $106.03 in long liquidations and nothing on the short side.
Zooming out to 4 hours, shorts took the bigger hit at $6.58K against $1.79K in longs.
The wider windows tell a different story. Over 12 hours, $354.51K in longs were liquidated against $65.99K in shorts, and over 24 hours long liquidations reached $570.07K against $168.78K in shorts, for a total of $738.85K rekt.
This suggests longs have been more exposed to sharp pullbacks over the past day even as ADA holds a broader uptrend.
Source: CoinGlass, Cardano Liquidation data, captured August 10, 2026.
Why Did ADA Break Its Ascending Trendline on the 4-Hour Chart?
ADA has been climbing along a well-defined ascending trendline on the 4-hour chart since late July, and the pattern was fairly clean.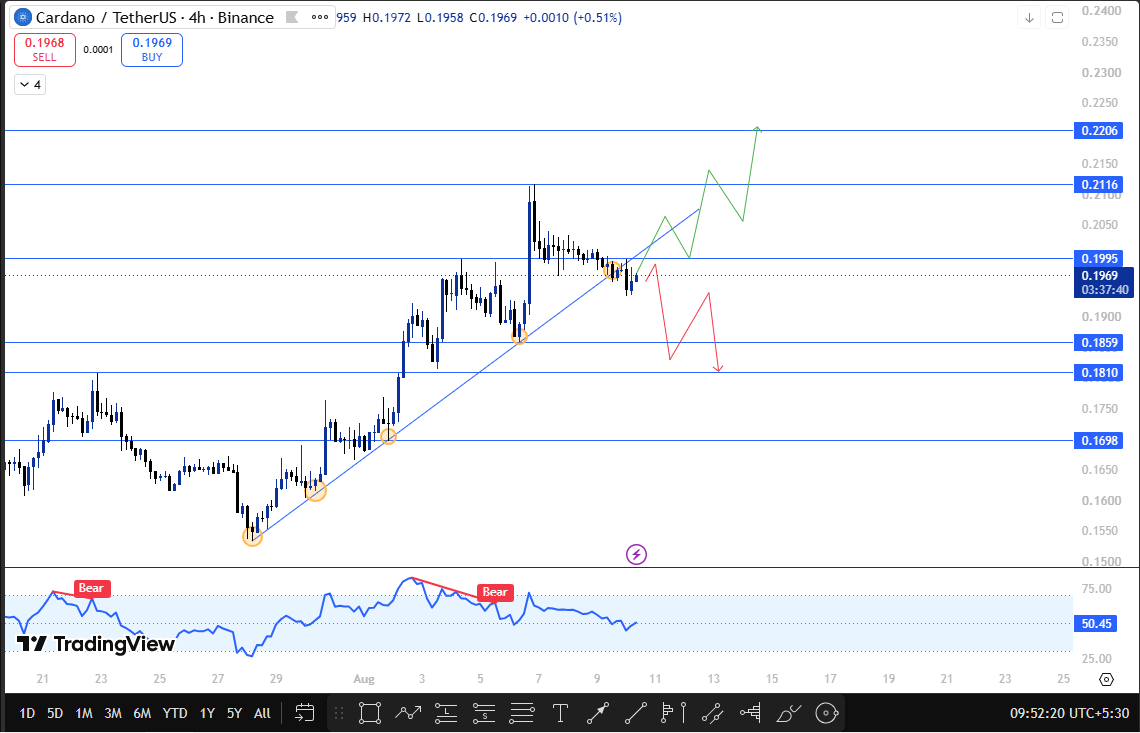
Each time the price pulled back to test the trendline, buyers stepped in and pushed ADA to a fresh higher high, a rhythm that repeated across three separate touches.
The fourth retest played out differently. Instead of bouncing cleanly off the trendline again, ADA broke through it, which technically ends that particular ascending structure.
This does not automatically mean the broader uptrend is over, but it does mean the next directional close matters a lot more than usual.
If ADA manages a close above 0.1995, that would open room toward 0.2116 first and then 0.2206 as the next resistance zone.
On the other hand, a close below 0.1859 would flip the near-term bias, with 0.1810 becoming the next support level to watch.
Adding to the picture, the chart's built-in momentum oscillator is showing a bearish divergence, marked by two separate bear tags connected by a declining trendline even as ADA's price kept printing higher highs into early August.
That kind of divergence often precedes a slowdown or a deeper pullback, so it is worth watching alongside the price action itself.
Glossary
Open Interest: the total value of outstanding futures contracts not yet settled
Liquidation: the forced closing of a leveraged position when losses exceed the trader's margin
Trendline: a line drawn connecting a series of price highs or lows to show the direction of a trend
Divergence: when price and a momentum indicator move in opposite directions, often signaling weakening momentum
Seasoning Period: the SEC mandated a waiting window for a regulated futures product to trade before a related spot ETF filing can be reviewed on a streamlined basis
Cardano Technical Outlook Snapshot
Indicator | Signal |
4H Trendline | Broken on 4th retest after 3 higher highs |
Momentum Oscillator | Bearish divergence, two lower highs on the indicator |
Structure Above CMP | Resistance cluster at 0.1995, 0.2116, 0.2206 |
Structure Below CMP | Support cluster at 0.1859, 0.1810 |
Cardano Support and Resistance Levels to Watch
Type | Level | Note | % From CMP |
Resistance | $0.2206 | Upper target on breakout continuation | +12.04% |
Resistance | $0.2116 | First major target above breakout zone | +7.47% |
Resistance | $0.1995 | The trigger level needs a close above to confirm a breakout. | +1.32% |
Support | $0.1859 | First support if breakdown confirms | -5.59% |
Support | $0.1810 | Deeper support target on continued breakdown | -8.07% |
Cardano Risk-Reward Table
Case | Trigger | Target |
Bullish | Close to $0.1995 | $0.2116, extended target $0.2206 |
Bearish | Close below $0.1859 | $0.1810 |
Traders should also be aware of the general risks around trading these levels.
False breakouts are common around trendline breaks, especially on lower volume closes, and leveraged positions near either trigger zone carry higher liquidation risk given the liquidation data already showing meaningful long side flushes over the past 24 hours.
What Would Change This Cardano Price Prediction?
This setup rests on two specific closes, above 0.1995 or below 0.1859.
If ADA instead chops sideways between those two levels without a decisive close on either side, the current trendline break stays unresolved, and this prediction would need revisiting with fresh chart data.
A change in the ETF timeline, such as Grayscale's filing status shifting earlier or later than expected, could also alter sentiment around ADA independent of the technical picture.
How Bitcoin Sentiment Could Move Cardano
Cardano tends to move with broader market sentiment more than it moves on its own news, aside from events like the ETF timeline above.
If Bitcoin sees a strong directional move, either from macro data or from its own technical levels, ADA's reaction at the 0.1995 or 0.1859 triggers could accelerate or stall depending on which way BTC is leaning at the time.
When This Cardano Price Prediction Gets Revisited
This analysis will be worth revisiting once ADA delivers a confirmed close above 0.1995 or below 0.1859 on the 4-hour chart, or once there is a concrete update on the Grayscale GADA filing status ahead of the October 23 window.
Bull, Base, and Bear Case
Bull Case: ADA closes above $0.1995 with rising volume, confirming the breakout and opening a path toward $0.2116 and $0.2206, aided by positive sentiment around the ETF seasoning period closing.
Base Case: ADA continues to chop between $0.1859 and $0.1995 without a decisive close on either side, keeping the broader trend structure unresolved in the near term.
Bear Case: ADA closes below $0.1859, confirming the trendline breakdown and the bearish divergence on the oscillator, with $0.1810 as the next level to watch.
Disclaimer
This article is for informational purposes only and should not be treated as financial advice. Cryptocurrency markets are highly volatile, and prices can move sharply in either direction. Please do your own research and consult a qualified financial advisor before making any investment decisions. CoinGabbar and the analyst do not hold a position in ADA at the time of publication

















