Chainlink Price Prediction: Chainlink Targets $20 On Bottomline News


Chainlink price prediction talk is heating up again after LINK quietly slipped out of a tight consolidation range that had been squeezing price for weeks.
Something shifted on the daily chart, the kind of move that catches a lot of traders off guard because the setup had gone almost boring before it suddenly was not.
A single candle changed the tone completely, and now the question everyone is asking is whether this is the real move or just another fakeout waiting to happen. Here is the full picture.
Chainlink Price Today: Live LINK Data and 24-Hour Change
Chainlink is trading around $11.652 at the time of this snapshot, holding a small daily gain of about 0.22% after opening near $11.628.
Futures volume across exchanges stands at $465.54 million against spot volume of $110.62 million, which shows derivatives activity is still the dominant force behind LINK's short-term price swings right now.
Open interest sits at $637.63 million, a fairly heavy figure that suggests plenty of leveraged positioning has built up around current levels.
Chainlink's market cap is at $8.70 billion, with a circulating supply of 748.09 million LINK out of a fixed total and max supply of 1 billion tokens.
Source: CoinGlass, Chainlink market data, accessed September 5, 2026.
Chainlink News: LINK Reclaims Levels Not Seen Since January
Chainlink just put in a milestone that had not shown up on the chart in months.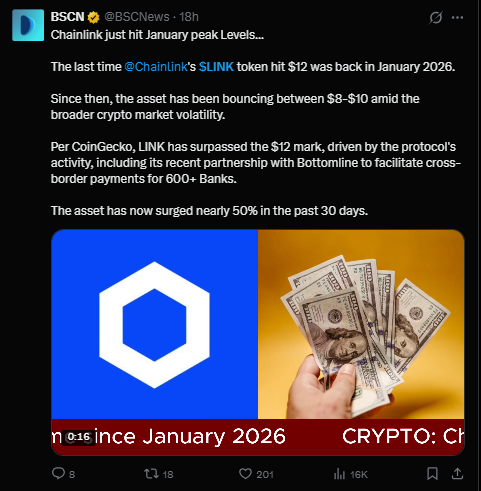
LINK briefly touched the $12 mark for the first time since January 2026, according to data cited from CoinGecko, after spending the months in between mostly stuck bouncing in an $8 to $10 range amid broader crypto market volatility.
Part of the renewed strength is being tied to ongoing protocol activity, including Chainlink's recent partnership with Bottomline aimed at helping facilitate cross-border payments for more than 600 banks.
Taken together, the token has climbed close to 50% over the past 30 days, and that kind of momentum is exactly the backdrop against which this breakout attempt is playing out.
Source: BSCN (@BSCNews) on X, posted roughly 18 hours before this snapshot, September 5, 2026.
LINK Technical Forecast: $LINK Price Prediction and Breakout Levels
On the daily chart, $LINK spent the back half of August and early September coiling inside a falling wedge pattern, with lower highs pressing down against a fairly firm support shelf underneath.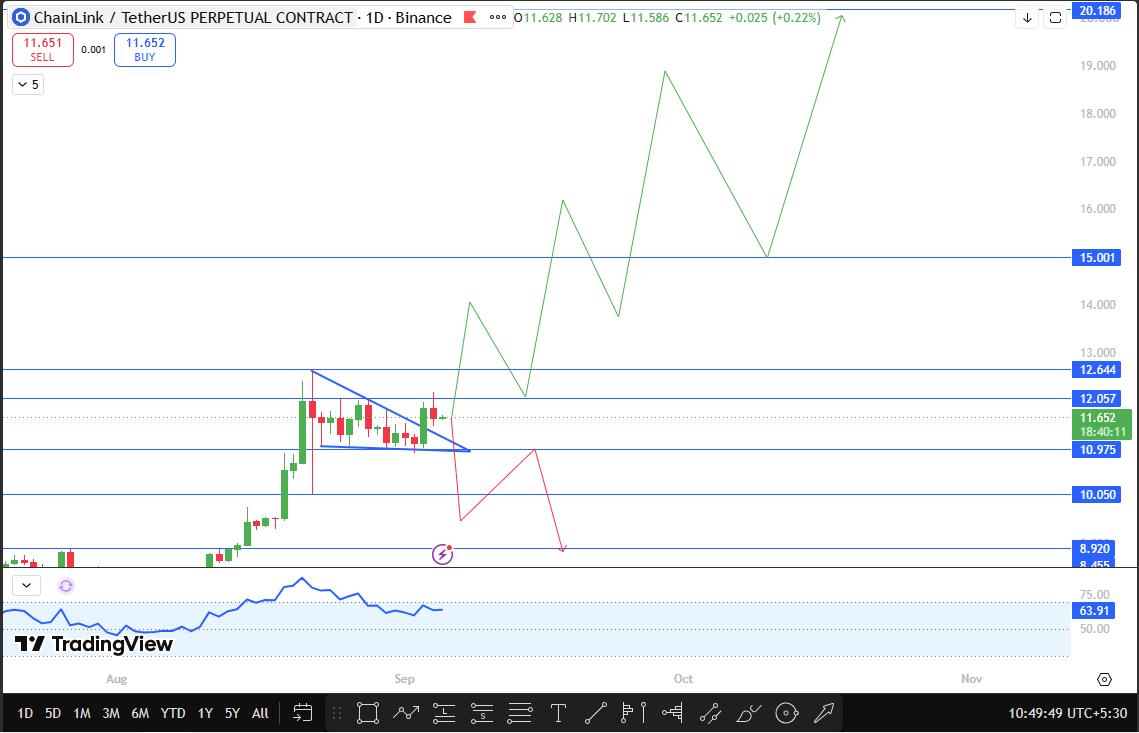
That kind of narrowing range usually ends in one direction eventually, and this time it resolved with a strong bullish daily candle that pushed price out of the top of the pattern.
That is generally read as a sign that buyers had been quietly absorbing supply the whole time the range looked dull.
Right now $LINK is sitting just under a key resistance band, and the next daily close is what will decide whether this breakout has real follow-through.
A daily close above $12.644 would confirm the move out of the falling wedge and effectively open the door for LINK to start pushing into fresh territory.
From there, $15.001 becomes the next resistance to watch, sitting roughly 28.7% above the current LINK price, with $20.186 marked out as the bigger resistance zone further out, close to 73.3% higher than where Chainlink trades today.
The downside scenario matters just as much here. If LINK instead closes below $10.050, roughly 13.7% under current price, that would suggest the breakout has failed, and the falling wedge pattern is reasserting itself as resistance rather than acting as a springboard.
In that case, the next meaningful support to watch sits at $8.920, about 23.4% below current levels, with a deeper support zone near $8.455 marked further down the chart if selling pressure were to extend beyond that first level.
For now, the bullish daily candle and the clean move out of the falling wedge keep the breakout scenario in the driver's seat, but confirmation still needs a daily close that holds above $12.644 rather than just a brief poke through it.
Source: TradingView chart, Chainlink LINK/USDT perpetual contract, Binance, 1D timeframe, snapshot dated September 5, 2026.
Support and Resistance Levels for LINK
Level Type | Price | Change from CMP |
Resistance 3 (Major) | $20.186 | +73.3% |
Resistance 2 | $15.001 | +28.7% |
Breakout Trigger | $12.644 | +8.5% |
Current Price (CMP) | $11.652 | — |
Support 1 | $10.975 | -5.8% |
Breakdown Trigger | $10.050 | -13.7% |
Support 2 | $8.920 | -23.4% |
Support 3 | $8.455 | -27.4% |
Bull, Base, and Bear Case for Chainlink
In the bullish case, LINK holds above the falling wedge breakout zone, pushes a daily close through $12.644, and rides the momentum from its recent 50% monthly rally plus the Bottomline partnership news toward $15.001 and eventually the $20.186 region.
The base case has LINK spending a few more sessions retesting the $11 to $12.644 zone, letting the breakout candle get digested before committing fully in either direction, which would be a fairly normal cooling-off period after such a sharp 30-day move.
The bearish case shows up if sellers manage to drag LINK back under $10.050. That would undo the recent breakout structure entirely, and given how much open interest is currently sitting in the market, a move like that could trigger a faster slide toward the $8.920 support zone as leveraged longs get flushed out.
Risks to Watch
Open interest above $600 million on $LINK means leverage is doing a lot of the heavy lifting in this move, and that cuts both ways.
A fast reversal wick could unwind a large chunk of recent longs just as quickly as the breakout formed, so treating $12.644 as a confirmation level rather than a guarantee matters here.
Broader market sentiment, additional Chainlink partnership news, and general crypto volatility can all shift this picture faster than the chart alone would suggest, so these levels work best as a framework for tracking the trend rather than a fixed roadmap.
Key Terms
Falling wedge: A consolidation structure where price compresses between converging trendlines before eventually breaking out in one direction.
Breakout confirmation: A close beyond a key resistance or support level that validates a chart pattern rather than a brief intraday move through it.
Open interest: The total number of outstanding derivative contracts that have not been settled, used as a gauge of active leveraged positioning.
Support shelf: A price zone where buying interest has repeatedly stepped in, acting as a floor during a consolidation phase.
Disclaimer
This article is for informational purposes only and does not constitute financial, investment, or trading advice. Cryptocurrency markets are highly volatile, and price predictions are based on technical analysis that can change quickly with new market data. Always conduct independent research and consult a qualified financial advisor before making investment decisions
Also read:
















