Chainlink Price Prediction: LINK Eyes $15 as Inflows Rise


This Chainlink price prediction comes right after a short-term chart pattern that had been quietly capping LINK's every attempt to move higher finally gave way.
A descending trendline on the hourly chart, one that had forced the price into a tightening range for days, has just been broken.
What happens in the hours ahead could decide whether this turns into a genuine push higher or just another brief escape before sellers step back in. Here is the full picture.
LINK Price Today: Live Data and 24-Hour Change
LINK is trading near $11.856 on the hourly chart, coming off an hourly candle that opened at $11.859, reached a high of $11.878, dipped to a low of $11.841, and closed at $11.856, down a negligible 0.02% for the hour.
Broader market data shows Chainlink around $11,852, up close to 5.27% over the past 24 hours, with futures volume of $484.03 million against spot volume of $77.95 million and open interest sitting near $691.16 million.
Market capitalization stands at roughly $8.87 billion on a circulating supply of 748.09 million LINK, edging closer to the total and max supply of 1.00 billion tokens.
Source: TradingView, LINK/USDT perpetual, 1-hour timeframe, Binance, and CoinGlass, both accessed August 27, 2026, IST.
Chainlink News and Catalyst
Spot LINK ETFs have been drawing sustained institutional interest, with reports pointing to a record-breaking 8-day inflow streak, the longest such run these products have ever posted.
That streak has brought in more than $18.27 million in net inflows during August alone, the strongest monthly figure these ETFs have seen since launch.
Commentary around the data frames Chainlink as an asset that has been underappreciated relative to its role in the industry, with this inflow trend suggesting that view may be starting to shift among institutional investors.
Source: BSCNews on X, accessed August 27, 2026, IST.
LINK Liquidation Data Today
Liquidation activity over the past 24 hours has been dominated almost entirely by short positions getting squeezed.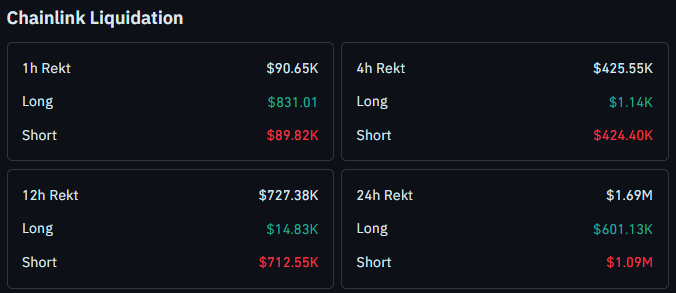
The 24-hour window shows $1.09M in short liquidations against just $601.13K in longs, while the 12-hour window shows an even sharper tilt at $712.55K short versus only $14.83K long.
The 4-hour window tells a similar story, with $424.40K in short liquidations against a negligible $1.14K in longs, and the most recent 1-hour window shows $89.82K in short liquidations against just $831.01 in longs.
This consistent pattern of short-side liquidations across every window lines up closely with the trendline breakout, suggesting sellers have been caught offside as price pushed through resistance.
Source: CoinGlass liquidation data, August 27, 2026.
Quick Take
CMP: $11.856
Hourly trigger: sustaining above the broken trendline and pushing higher opens $12.638, then $15.428
Hourly failure: close below $11.037 fails this breakout, with next support at $10.041
Data as of August 27, 2026, IST
Short risk note: these levels come from the hourly chart and depend on confirmed hourly closes, not intraday wicks. Leveraged positions around these zones carry liquidation risk if price whipsaws before a level is confirmed.
Chainlink Technical Forecast
LINK spent several days consolidating under a descending trendline on the hourly chart, with each rally attempt getting capped along that falling line as price grounded sideways between roughly $11.037 and $12.638.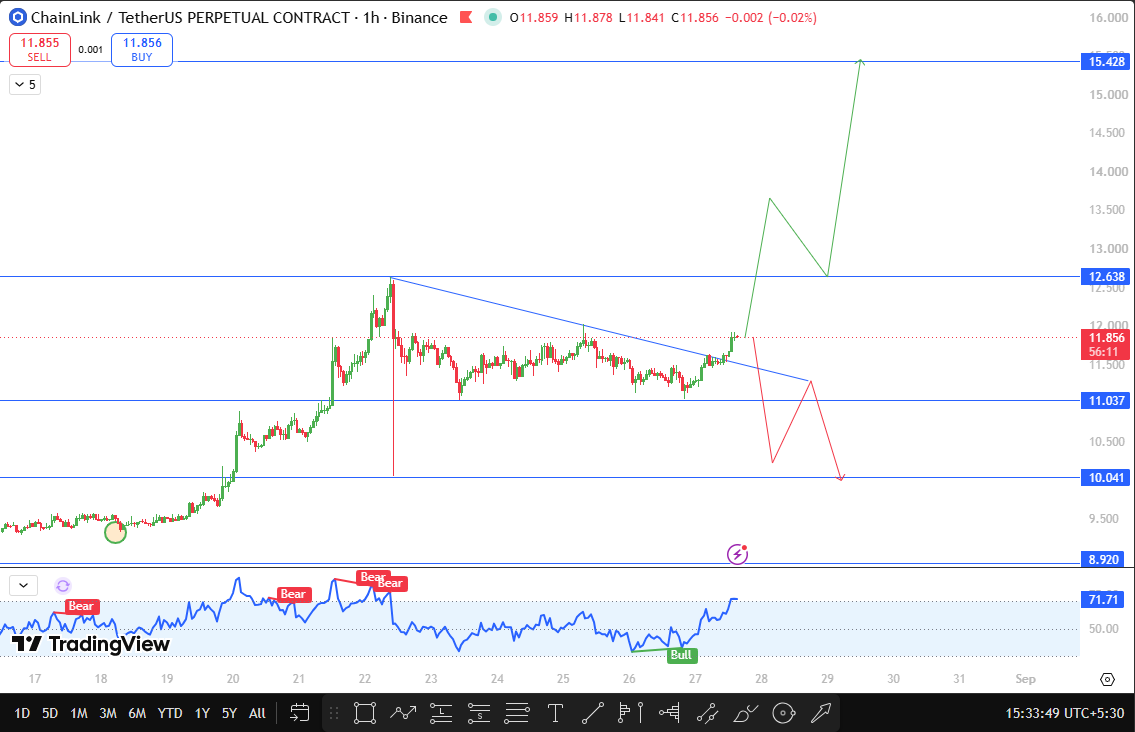
That kind of tight, range-bound compression under a defined trendline often builds up pressure that eventually resolves in a sharp move once the line finally gives way, and that is exactly what has just happened here.
Price has broken above the descending trendline, and the reaction has come alongside heavy short-side liquidations, a combination that suggests real buying pressure rather than a thin technical wick.
The hourly momentum indicator is currently reading near 71.71 and carries a bullish tag on the chart, showing strength building behind this move without yet reaching extreme overbought territory.
If LINK can sustain above this trendline break and continue pushing higher, this Chainlink technical analysis points to $12.638 as the next resistance, an old swing high that capped price action just before the breakout.
Clearing that opens the door toward $15.428 as the major upside target, a level that would mark a substantial extension if this breakout continues to hold.
On the downside, this breakout only fails if LINK breaks and closes below $11.037.
That would suggest the trendline break was a false move rather than a genuine shift, opening the path toward $10.041 as the next support to watch.
As with the upside targets, both of these support levels come from old swing lows on the chart rather than arbitrary numbers.
Source: TradingView, LINK/USDT perpetual chart, 1-hour timeframe, Binance, captured August 27, 2026, IST.
LINK Support and Resistance Levels to Watch
Level Type | Price | Change from CMP | Note |
Support | $10.041 | -15.31% | Next support if breakout fails |
Support | $11.037 | -6.91% | Breakout failure trigger |
Resistance | $12.638 | +6.60% | Old swing high, first target after breakout |
Resistance | $15.428 | +30.13% | Major upside target |
Chainlink Price Prediction: Bull, Base, and Bear Cases
The base case has LINK consolidating just above the broken trendline in the near term, digesting the recent breakout without yet confirming a decisive push through $12.638.
The bull case activates if LINK sustains above the trendline break and pushes higher, opening a path toward $12.638 first and then the major target at $15.428.
This LINK breakout prediction gets support from the heavy short-side liquidations seen across every timeframe, along with improving momentum and a broader institutional inflow trend feeding into Chainlink's narrative.
The bear case needs a break and close below $11.037, which would mean the trendline breakout has failed to hold, putting a retest of $10.041 back in focus and suggesting the range-bound consolidation that preceded this move is reasserting itself.
On-Chain and Fundamental Drivers
The record inflow streak into spot LINK ETFs adds a fundamental layer to this setup that goes beyond the short-term chart pattern, pointing to growing institutional demand for exposure to Chainlink specifically rather than the broader altcoin market.
With circulating supply at 748.09 million, already close to the 1.00 billion max supply cap, LINK carries limited future dilution risk, meaning any sustained inflow trend does not have to compete against significant new token issuance.
Open interest near $691.16 million against an $8.87 billion market cap also shows meaningful but not excessive leverage in the derivatives market, leaving room for this move to extend.
Glossary
Descending trendline: a downward-sloping line connecting a series of lower highs, acting as dynamic resistance until price breaks above it
Trendline breakout: a move where price closes beyond a trendline that had previously capped upside
Hourly close: the final traded price when an hourly candle finishes, used to confirm whether a breakout or breakdown is genuine
Open interest: the total number of outstanding futures or options contracts that have not yet been settled
Support: a price zone where buying pressure has previously stepped in
Resistance: a price zone where selling pressure has previously capped upside
Invalidation level: the price point at which a forecast scenario is considered incorrect
Disclaimer
This article is for informational purposes only and does not constitute financial advice. Cryptocurrency markets are highly volatile, and all price levels discussed are based on technical chart analysis, not a guarantee of future performance. Readers should conduct their own research before making any investment decisions.

















