Sui Price Prediction: SUI Traders Watch as Volume Surges Past $599M


In this SUI price prediction, $SUI runs on an object-centric data model, which sets it apart from the account-based structure most Layer-1 chains use.
It's built for speed and cheap transactions, and its mainnet went live back in 2023.
Since then, a fairly active app ecosystem has grown around it. Right now, SUI currently trades at $0.7675, down 0.4% over the last day, and that price point is central to any current Sui price prediction.
Market cap stands near $3.144 billion, and there are 4.097 billion coins circulating out of a 10 billion max supply.
Sui Coin Live Market Data
Metric | Value |
Current Price | $0.7675 |
24h Change | -0.4% |
24h Range | $0.7405 - $0.7822 |
Market Cap | $3.144B |
Outstanding Token Value | $3.461B |
Fully Diluted Valuation | $7.674B |
24h Trading Volume | $461.953M |
Circulating Supply | 4.097B |
Outstanding Supply | 4.51B |
Total Supply / Max Supply | 10B |
Source: SUI market cap data taken from CoinGecko, data as of Sep 05, 2026. Figures may vary slightly across other tracking websites.
Liquidation Snapshot
Something interesting shows up in the liquidation numbers. Across nearly every timeframe, long traders are the ones getting burned, a sign that leveraged bulls piled in a bit too early.
Timeframe | Total Liquidated | Long | Short |
1h | $464.89 | $35.65 | $429.24 |
4h | $16.37K | $10.98K | $5.40K |
12h | $88.97K | $23.31K | $65.67K |
24h | $1.86M | $1.78M | $88.46K |
Source: Liquidation Data Taken From CoinGlass, As of Sep 5, 2026
Exchange Volume
Binance dominates $SUI trading by a wide margin, though OKX and Bitget both carry meaningful volume too.
Exchange | Volume |
Binance | $245.54M |
OKX | $96.65M |
Bitget | $81.39M |
Bybit | $77.28M |
MEXC | $48.88M |
WhiteBIT | $47.44M |
BingX | $22.04M |
Bitunix | $19.32M |
Gate | $14.82M |
KuCoin | $13.68M |
Source: Volume Heatmap Data Taken From CoinGlass, As of Sep 5, 2026
Sui Coin News Today
A $599 million volume figure doesn't go unnoticed, and it hasn't.
One post specifically flagged that $SUI's 24-hour trading volume had crossed the $599 million mark, framing it as a "JUST IN" development worth watching.
Source: Data Taken From @Criptoovar, X Account, As of Sep 05, 2026
Crypto commentators picked up on the spike almost immediately, tying it to the timing of SUI's chart structure flip.
That's not a coincidence; traders tend to ignore it. Volume backing a breakout carries more weight than a breakout on thin trading. There's also chatter on the infrastructure side.
Technical Analysis: Sui Price Prediction Forecast
In the 4-hour chart of SUI, here's what changed. $SUI spent late August boxed inside a descending channel of lower highs and lower lows, the usual grind.
Then the price broke above that channel's upper boundary, and the whole structure flipped. 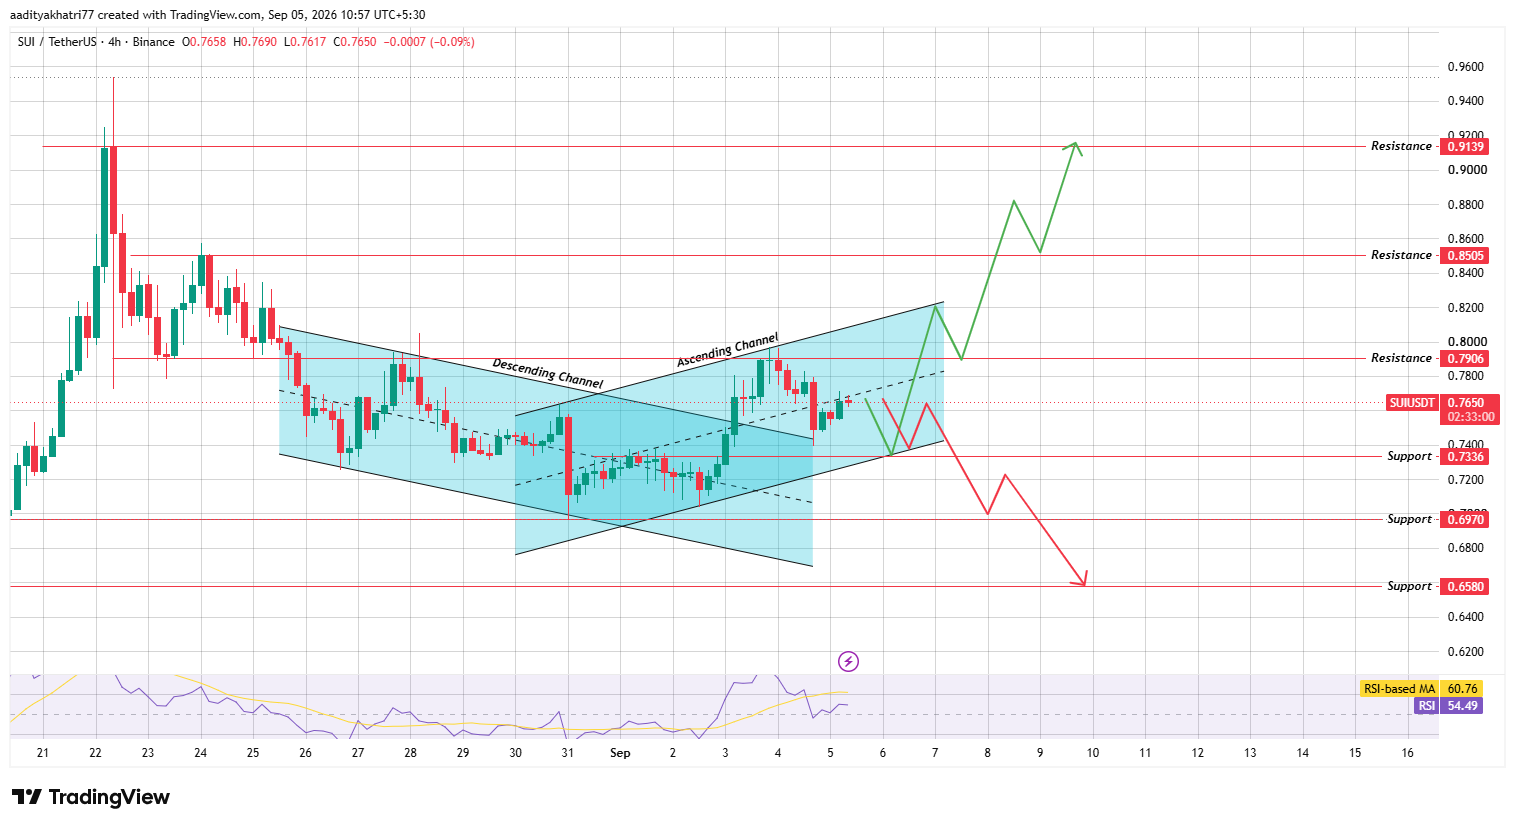
Source: Chart Taken From TradingView, As of Sep 5, 2026
A new ascending channel formed, and that's where $SUI sits today, roughly in the middle.
So what's next?
Push higher first, and $0.7906 is the immediate hurdle. Clear that with real volume behind it, plus a confirmed close above the ascending channel's top boundary, and $0.8505 opens up. From there, momentum could stretch toward $0.9139.
Go the other way, though, and the picture changes fast. A drop toward the channel's lower boundary, followed by a confirmed breakdown, puts $0.7336 in play first. Keep falling, and $0.6970 is next, with $0.6580 as the floor if sellers stay in control.
Support & Resistance Levels
Type | Level |
Resistance 3 | $0.9139 |
Resistance 2 | $0.8505 |
Resistance 1 | $0.7906 |
Support 1 | $0.7336 |
Support 2 | $0.6970 |
Support 3 | $0.6580 |
RSI sits at 54.49 right now not overbought, not oversold, just sitting there. The RSI-based moving average reads a bit higher at 60.76, which hints momentum has cooled slightly but hasn't flipped bearish.
Glossary
Descending channel: Picture two downward-sloping lines running parallel, boxing price in between as it grinds lower over time.
An ascending channel flips that idea: support and resistance both trend upward, and price bounces between them as the broader move climbs.
Liquidation happens when a leveraged trade gets forced shut because losses eat through the trader's margin faster than they can respond.
And RSI is a 0-to-100 gauge tracking how fast and how far the price has moved recently, mainly used to spot when something's gotten overbought or oversold.
SUI vs Bitcoin
SUI haven't really been dancing to Bitcoin's tune lately. The channel flip and the volume spike both look like SUI-specific stories; nothing in the Bitcoin price today chart action explains either one. That matters for how you read this setup.
Right now, what happens to SUI probably depends more on SUI's own volume and structure than on any Bitcoin price prediction floating around the market currently.
Expert Opinion
Traders watching this setup point to something fairly intuitive: when a channel flips direction and volume jumps at the same time, it usually means the market's hunting for a new trend rather than just drifting.
That reading fits what's on the chart: $SUI parked mid-channel, waiting on confirmation before it commits either way.
Disclaimer: This Sui price prediction relies on technical chart analysis and current market data; it isn't financial advice. Crypto markets move fast and unpredictably, and actual price action can diverge sharply from what's outlined here. Every support and resistance level above represents a probability zone, not a guarantee, and downside risk exists at each stage of this analysis. Do your own research before making any investment decision.
Also read:
















