DeXe Price Prediction: $DEXE $1.34 Liquidity Pending, Bounce or Bust?


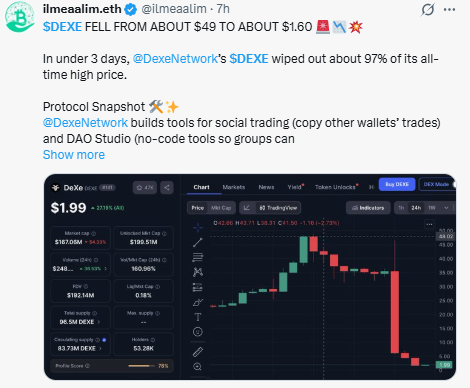
$DEXE is one of the biggest movers in the market this week after crashing roughly 97% from a reported exchange-specific high near $49 to about $1.60 in under three days, following a sharp short squeeze that pushed the token to that peak in the first place.
DeXe Network builds tools for social and copy trading along with DAO Studio, a no-code way to launch and run a DAO with AI-assisted treasury and voting features.
This DeXe Price Prediction looks at the chart, liquidation data, and key liquidity zones to assess whether it can recover or face another breakdown. The key level now is $1.9200.
$DEXE Price Today: Market Overview
| Metric | Value |
| Price (DEXE/USD) | $2.3171 |
| 24h Change | -34.7% |
| 24h Range | $1.57–$3.92 |
| Market Cap | $221.03M |
| Fully Diluted Valuation | $221.03M |
| 24h Trading Volume | $210.165M |
| Circulating Supply | 96.505M $DEXE |
| Total Supply | 96.505M $DEXE |
Source: Data from CoinGecko as of 24/07/2026. Figures may vary slightly across other tracking websites.
The price remains highly volatile following the sharp move from the reported high near $49. Traders should therefore focus on confirmed exchange data and avoid treating a single exchange wick as a universally recognized all-time high.
Liquidation and Volume Data
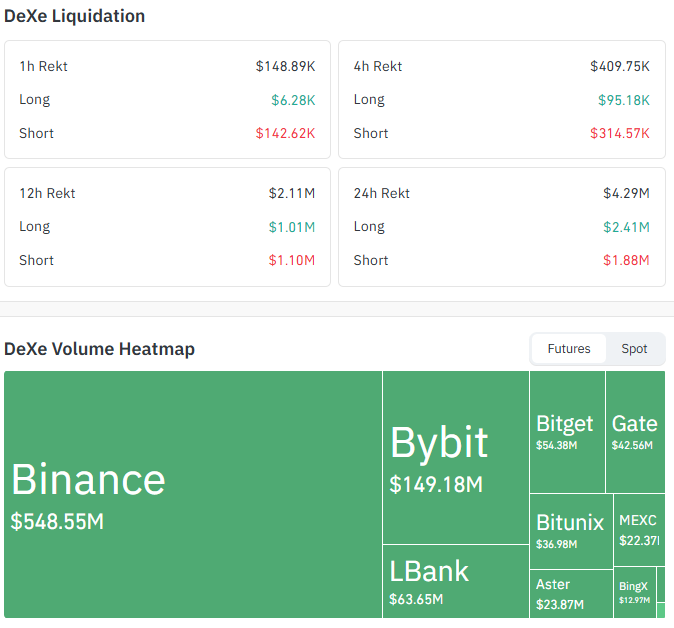
Liquidations show a mixed picture depending on the timeframe. Over the last hour and four hours, short sellers took the bigger hit. Shorts accounted for $142.62K of $148.89K in one-hour liquidations and $314.57K of $409.75K over four hours.
This suggests that short sellers have recently faced another squeeze as it attempted to stabilize.
However, the picture flips over longer periods. During the past 24 hours, long liquidations reached approximately $2.41M compared with $1.88M in short liquidations. That imbalance reflects the broader crash that followed the extreme price spike.
Source: Data From CoinGlass
Futures volume is dominated by Binance at approximately $548.55M, ahead of Bybit at $149.18M and LBank at $63.65M. This indicates that leverage and derivatives activity are playing a major role in the current price movement.
$DEXE News Today: Why Is DEXE Price Moving?
DEXE's recent move appears to have started with a listing-related catalyst around July 9. The rally accelerated between July 10 and July 13 as traders positioned for further upside and short sellers were forced to buy back positions.
The resulting short squeeze pushed $DEXE to a reported high near $49 on July 13 before the token gave back nearly all of those gains.
However, the exact status of the $49 level requires caution. Unless multiple major spot trackers confirm the same price, it should be described as an exchange-specific high rather than the official global all-time high.
Before republication, the article should specify the exact exchange, trading pair, market type, candle time, and data provider associated with the $49 print.
Separately, social media posts have circulated claims that large DEXE amounts moved from team-linked wallets toward Binance. Some posts describe this as a team dump, while others allege that the funds were connected to a compromised wallet.
Neither claim has been confirmed by DeXe Network or independently verified. There is currently no confirmed evidence of a hack or smart-contract breach.
These claims should therefore be treated as unverified social media allegations until DeXe Network or a reliable independent source provides confirmation.
DEXE Price Forecast: Chart Analysis
DEXE has been in a steep downtrend since its peak, with price action tracking a descending trendline that has capped recovery attempts.
The chart shows an initial sharp decline followed by sideways consolidation. The consolidation range extended toward approximately $4.3908 on the upper side, while the 50 EMA was correctly measured at $5.0516, not $0.0516.
After breaking below the $3.8111 level, DEXE continued lower and eventually found a potential basing area near $1.9200. The token is now attempting to stabilize and move back toward the descending trendline from below.
The descending trendline should be defined using the July 13 high at [verified price] and the subsequent lower high on [verified date] at [verified price]. Confirmation requires a [verified timeframe] candle close above the trendline, followed by a successful retest that holds as support.
Until those anchor points and the exact chart timeframe are verified from the source chart, the trendline should be treated as a visual technical reference rather than a precisely quantified resistance level.
The EMA readings are 20 EMA at $2.3529, 50 EMA at $5.0516, 100 EMA at $11.4547, and 200 EMA at $19.6224. These readings show that DEXE is trading below every major EMA. The EMAs are also arranged in a steep bearish order, confirming that the broader trend remains negative.
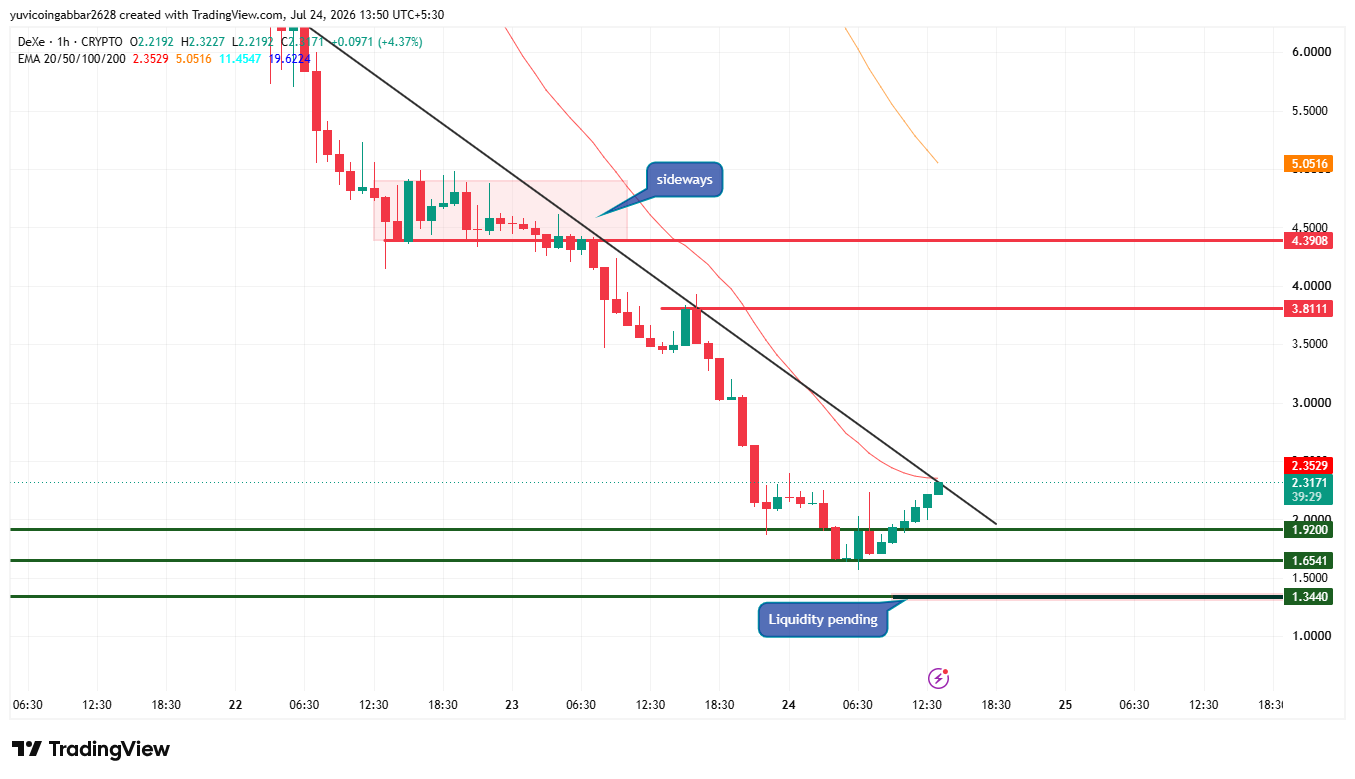
The descending trendline is therefore the immediate structural level bulls need to overcome.
DEXE Support and Resistance Levels
| Level | Price | Type |
| Resistance | $4.3908 | Former sideways range top |
| Resistance | $3.8111 | Major breakdown level from the previous consolidation |
| Immediate price reference | $2.3171 | Current price area and potential test of the descending trendline from below |
| First support | $1.9200 | Recent basing zone and the most important level for the current recovery attempt |
| Support | $1.6541 | Next downside level if $1.9200 fails |
| Deeper liquidity zone | $1.3440 | Potential target if selling pressure accelerates below the lower support levels |
DEXE Price Prediction: Bull, Base and Bear Scenarios
| Scenario | Target | Trigger | Timeframe | Invalidation Level |
| Bullish | $3.8111 | Break above the descending trendline, hold $1.9200 as support, and rising volume | 3 to 7 days | Close back below $1.9200 |
| Base | $1.9200 to $3.8111 | Price consolidates without a confirmed trendline breakout | 3 to 7 days | Daily close outside either side of the range |
| Bearish | $1.3440 | Break below $1.9200 with continued long liquidations | 3 to 7 days | Reclaim of $1.9200 on rising volume |
Two Scenarios: Bounce vs Breakdown
Bounce scenario: If DEXE clears the descending trendline and continues holding $1.9200 with rising volume, the next major test would be $3.8111. A successful breakout above that level could open the way toward $4.3908.
For this bullish thesis to remain valid, DEXE needs to maintain $1.9200 as support. A daily close below that level would weaken the setup.
Breakdown scenario: If $1.9200 fails, DEXE could slide toward $1.6541. Continued selling pressure could then expose the deeper $1.3440 liquidity zone.
A reclaim of $1.9200 on strong volume would weaken the bearish thesis.
Risk Note
DEXE remains highly volatile after an approximately 97% drawdown from the reported exchange-specific high near $49. The initial rally was heavily influenced by a short squeeze, meaning the subsequent decline may reflect the unwinding of leveraged positions rather than a simple change in fundamental demand.
Unverified social media claims about wallet movements add another layer of uncertainty. Until DeXe Network addresses those claims directly, investors should avoid treating them as confirmed evidence of insider selling, a team dump, or a security breach.
DeXe Technical Analysis: Expert View
The chart and liquidation data suggest that DEXE is still working through the aftermath of an extreme short-squeeze-driven rally and subsequent crash.
Recent short liquidations during the one-hour and four-hour windows may provide temporary relief, but the broader technical structure remains bearish because price is below the 20, 50, 100, and 200 EMAs.
The most important level is $1.9200. Holding this zone while breaking above the descending trendline could improve the short-term recovery setup and expose $3.8111 and $4.3908.
On the other hand, losing $1.9200 could shift attention toward $1.6541 and the deeper $1.3440 liquidity zone.
A genuine trend reversal would require more than a short-term bounce. Traders should look for a confirmed trendline breakout, sustained volume, and successful support retests before considering the broader downtrend invalidated.
Disclaimer
This article is for informational purposes only and should not be considered financial or investment advice. Cryptocurrency markets are highly volatile, and prices can change rapidly based on market conditions. Readers should conduct their own research and consult a qualified financial advisor before making investment decisions. CoinGabbar does not guarantee the accuracy of price predictions, and past performance is not indicative of future results.

















