RE Price Prediction: Re Protocol Token Surges 36% on Breakout


RE price prediction searches spiked this week after Re Protocol's native token ripped more than 36% in 24 hours, breaking out of a multi-week rounded-bottom base. Anyone running an $RE coin price prediction today is essentially asking one question: is this the start of a genuine trend reversal or a sharp relief bounce inside a longer downtrend?
This RE crypto price prediction breaks down the technicals, tokenomics, and catalysts behind the move and offers an $RE token price prediction across the near term and out to 2026, 2027, and 2030.
The setup echoes the kind of reversal pattern covered in our Solana bullish price flip breakdown, where a base-building phase preceded a sharp move higher. Here's what the data shows.
Why RE Is Back On Traders' Radar
RE jumped over 36% in a day, changing hands around $0.6385, with 24-hour volume topping $160M, more than 150% of its own market cap, according to live data on the RE Protocol CoinMarketCap page. The move followed a rounded-bottom recovery pattern on the 4-hour chart that had been building for roughly two weeks, and it comes as Re Protocol pushes fresh incentive programs across its reUSD stablecoin products with partners including Fluid and Tangent. For anyone tracking RE crypto forecast chatter today, this is the single biggest driver of renewed attention.
Token Contract
Contract Address: 0x526526528f35ac738177003b8773b402b8df8143
Standard: ERC-20
Full holder history and transfer data are viewable on the RE token Etherscan explorer.
Key Takeaways
-
$RE trades near $0.6385 as of July 24, 2026, up roughly 36% in 24 hours.
-
The token sits about 40% below its all-time high of $1.09, set roughly a month ago on June 21, 2026, a drawdown comparable in scale to the one detailed in our SpaceX stock drawdown analysis.
-
It's up over 81% from its all-time low of $0.3576, set just four days ago on July 20, 2026.
-
4-hour RSI reads 75.07, solidly in overbought territory after the breakout.
-
Market cap sits around $101.9M on a circulating supply basis, with fully diluted valuation near $639M given only 159.6M of the 1B token supply currently circulating.
-
Liquidity relative to market cap is extremely thin, at roughly 0.01%, despite the heavy trading volume.
-
Holder count sits at just over 10,000 addresses, with supply concentration among the highest seen in recent launches.
-
Short positions have been squeezed hard, with 24-hour short liquidations of roughly $1.47M versus $374.78K in long liquidations.
Where RE Stands Right Now
$RE last traded around $0.6385, up roughly 36% over the past 24 hours, with a 24-hour range running from a low of $0.4633 to a high of $0.6731. The circulating supply sits at 159.6 million RE against a fixed 1 billion max supply putting the circulating market cap near $101.9M and the unlocked market cap closer to $129M.
The fully diluted valuation is far higher, near $639M, reflecting the large share of supply still locked or unreleased, a dilution gap similar in shape to the one discussed in our Bitcoin to Ethereum rotation coverage on circulating-versus-diluted valuations.
The all-time high of $1.09 was set about a month ago, on June 21, 2026, meaning the current price is still down roughly 40% from that peak. The all-time low of $0.3576 was set only four days ago, on July 20, 2026, so this rally is, so far, a bounce off a very recent bottom rather than a new leg to fresh highs.
What's Driving $RE's Price Today
Re Protocol's own channels have been active with incentive announcements tied to its reUSD stablecoin, a pattern of ecosystem-driven momentum similar to what's covered in our crypto market rally today roundup. Recent posts confirm the Re Protocol Curve pool on sUSG/reUSD via Tangent, offering elevated APR and 20x Re points, alongside a separate Re Protocol Fluid partnership offering multipliers on reUSD/USDT liquidity and reUSD collateral positions.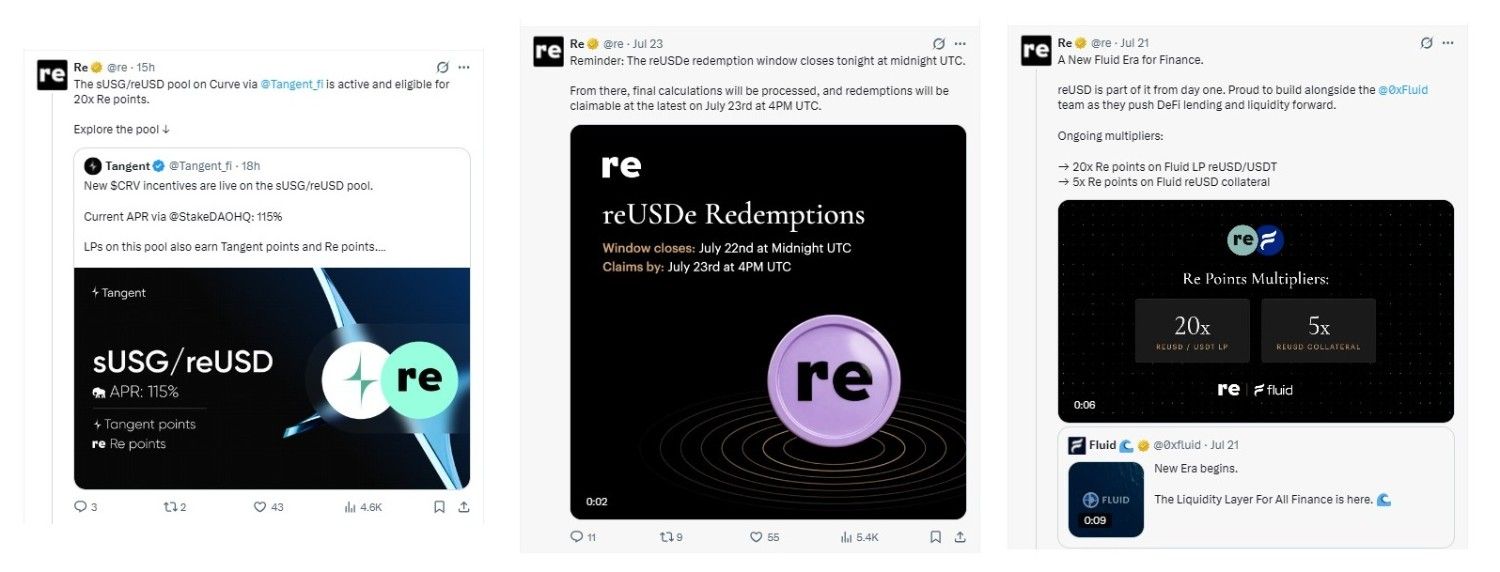
Separately, the project confirmed via a reUSDe redemption announcement that its earlier product's redemption window has closed, with final claims processed shortly after, a sign the team is consolidating its stablecoin lineup around reUSD. Heavy short liquidations over the past 24 hours suggest part of the move was amplified by a squeeze, on top of the underlying news flow.
$RE Price Analysis: Technical Breakdown (4-Hour Chart)
This $RE price analysis starts on the 4-hour RE/USDT chart, visible on charting tools like the TradingView charting platform, which shows a rounded-bottom pattern: price ground sideways-to-down for roughly two weeks before curling higher and breaking above its prior consolidation range. 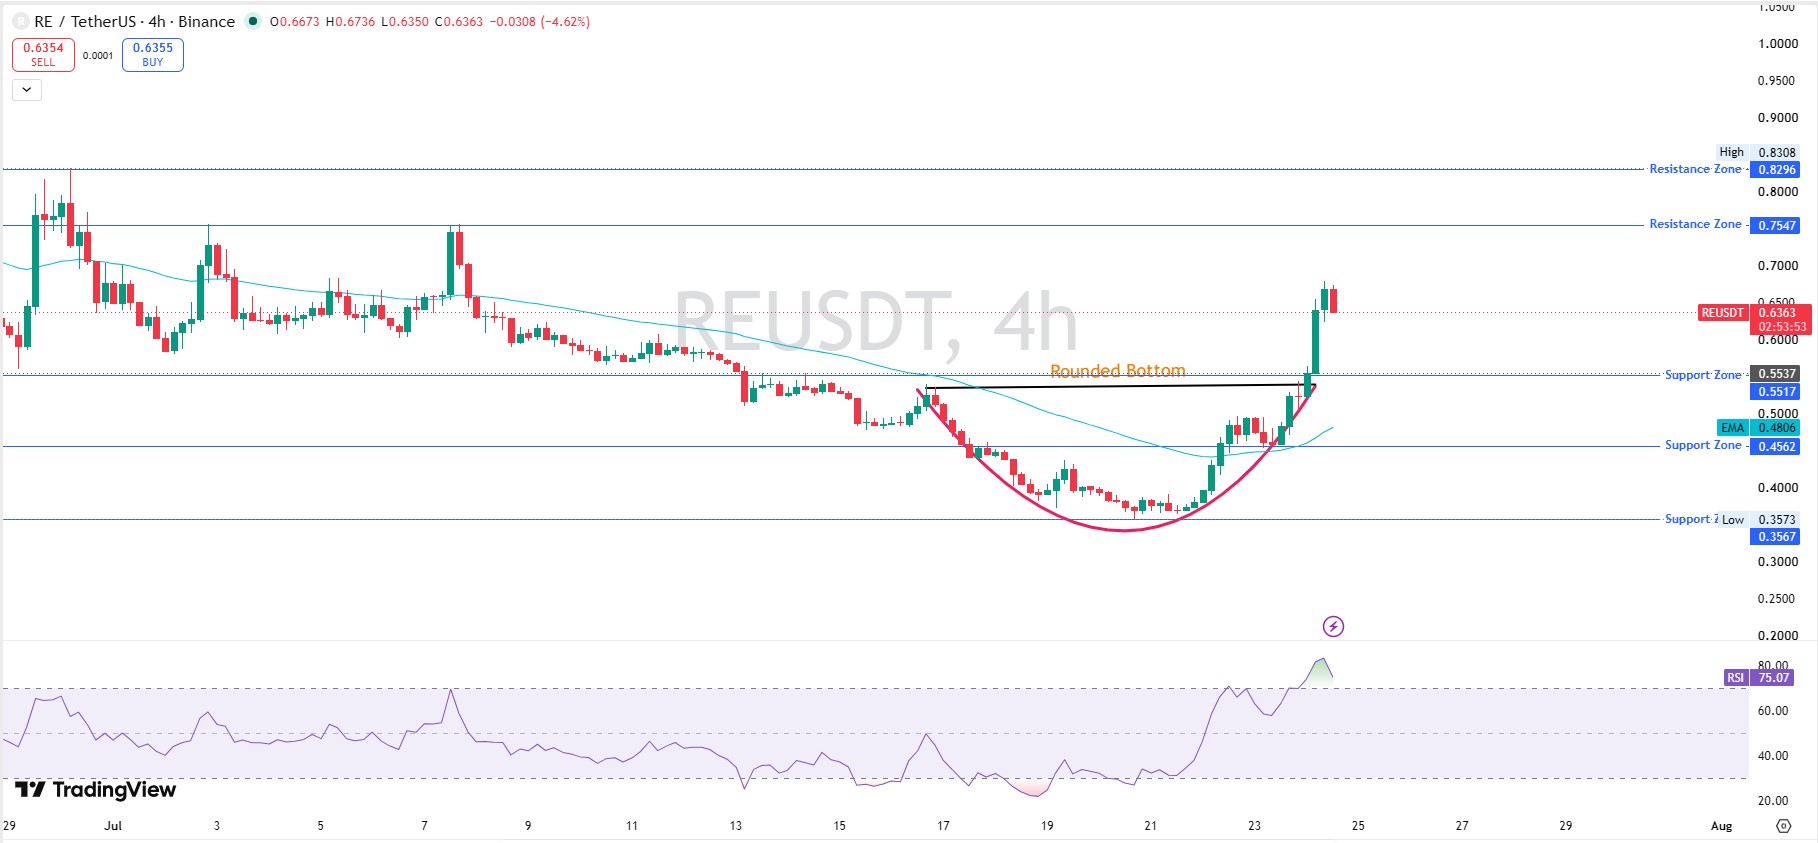
RSI on this timeframe reads 75.07, meaningfully overbought, which raises the odds of a near-term cooling-off period even within an intact uptrend, a resistance-rejection setup worth comparing against the one flagged in our XRP resistance-rejection analysis.
Support and Resistance Snapshot (4H)
| Level Type | Price |
|---|---|
| Resistance 2 | $0.8296–$0.8308 |
| Resistance 1 | $0.7547 |
| Current Price | $0.6363 |
| Support 1 | $0.5517–$0.5537 |
| Support 2 (EMA) | $0.4562–$0.4806 |
| Support 3 | $0.3567–$0.3573 |
Technical Analysis: Weekly Chart
The weekly chart tells a more cautious story. $RE has been trading inside a descending channel since its June high, and the latest weekly candle is a sharp reversal: it opened at $0.3931, ran to a high of $0.6791, dipped to a low of $0.3573, and closed near $0.6405, a roughly 63% weekly gain. 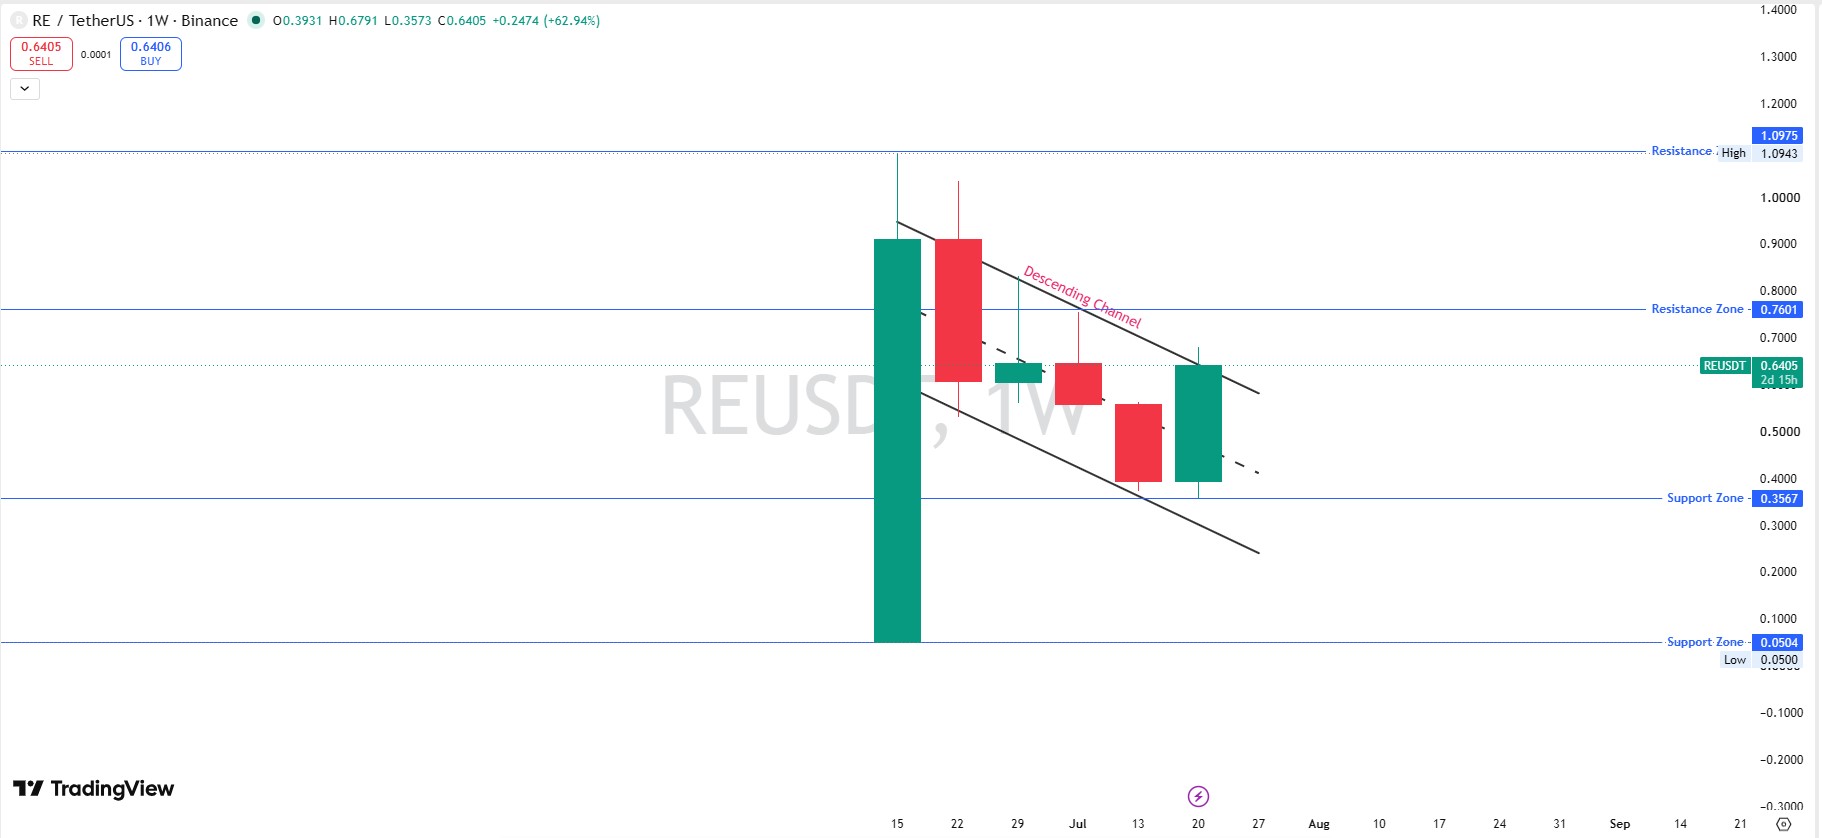
That's a strong single-week move, but it's the first real break of the descending channel structure, not yet a confirmed trend change, similar to the scenario framing used in our Bitcoin bull-bear scenarios outlook.
Support and Resistance Snapshot (Weekly)
| Level Type | Price |
|---|---|
| Resistance 2 | $1.0943–$1.0975 |
| Resistance 1 | $0.7601 |
| Current Price | $0.6405 |
| Support 1 | $0.3567 |
| Support 2 | $0.0500–$0.0504 |
RE Market Analysis: Tokenomics and Holder Concentration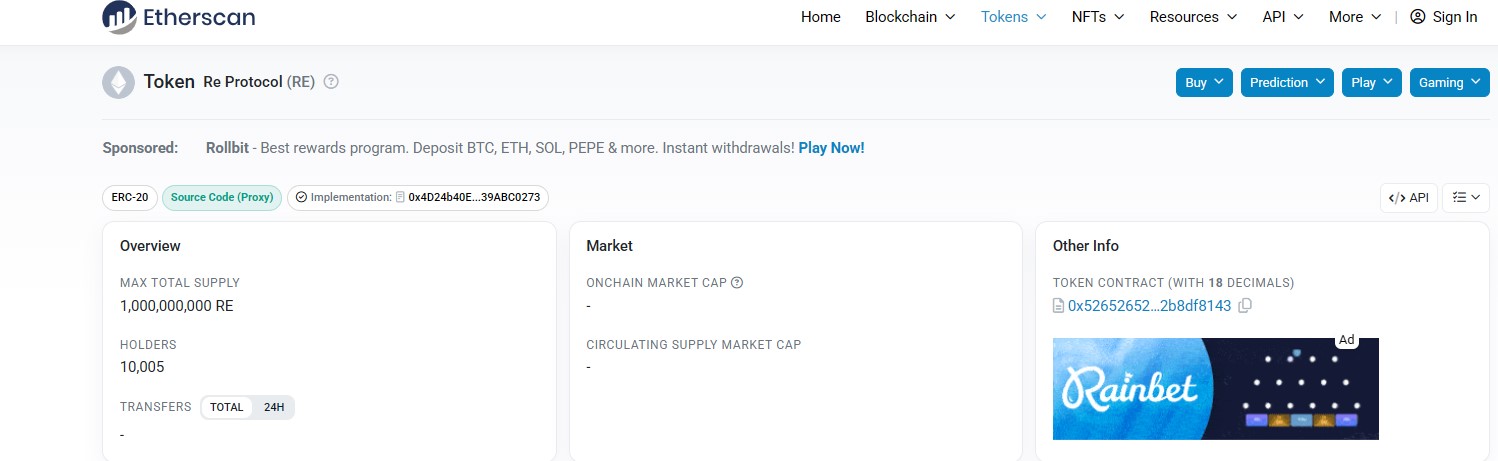
This $RE market analysis of on-chain data shows total supply fixed at 1 billion RE, with roughly 159.6 million circulating and just over 10,000 holders on record. Concentration is extremely high: the top 100 wallets control 99.90% of supply, and just 41 "whale" wallets (0.41% of holders) hold 99.77% of all tokens. The Gini distribution score sits at 0.9991, and only 8 wallets hold at least 1% of the total supply each, a concentration pattern worth tracking the way our XRP whale accumulation data coverage tracks large-wallet buildup.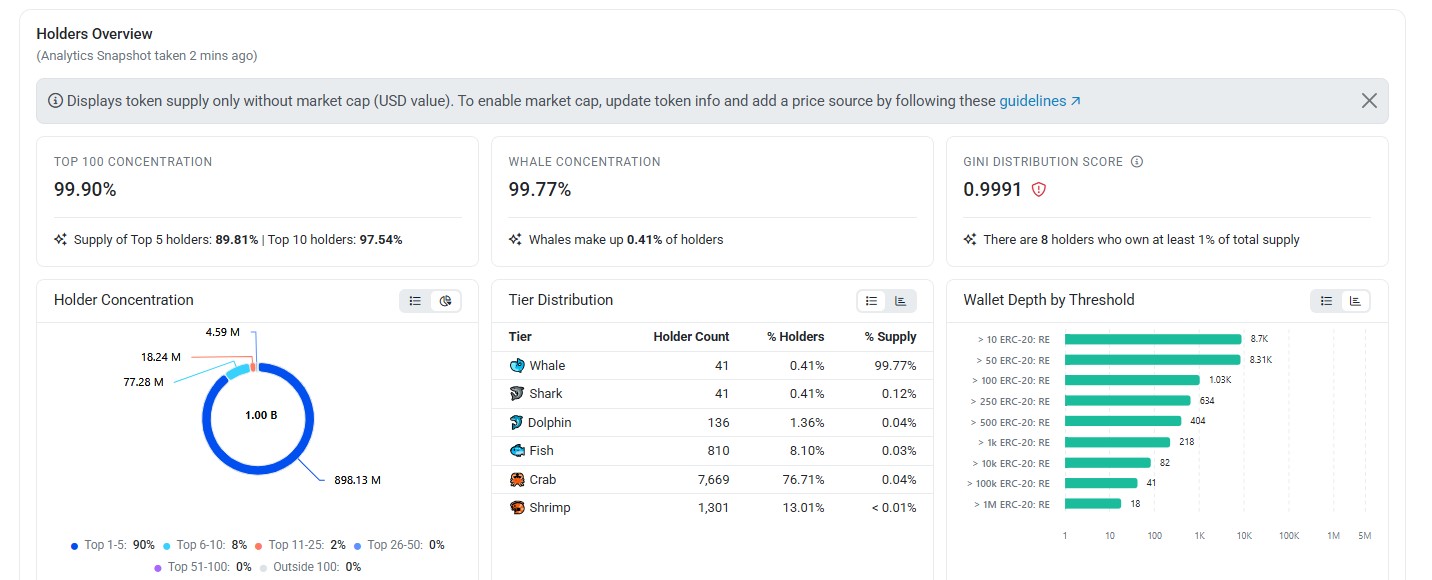
The single largest holder is Hedgey Finance: Bound Lockups, holding roughly 34% of the supply, with a vesting/lockup contract rather than being an active seller. Beyond that, several large unlabeled wallets hold significant chunks (20%, 16.5%, 13.5%, 5.8%, and 2.65%, respectively), representing real potential sell pressure once any lockups expire. Binance and Robinhood exchange wallets round out the top 10 with smaller allocations of 1.3% and 0.37%.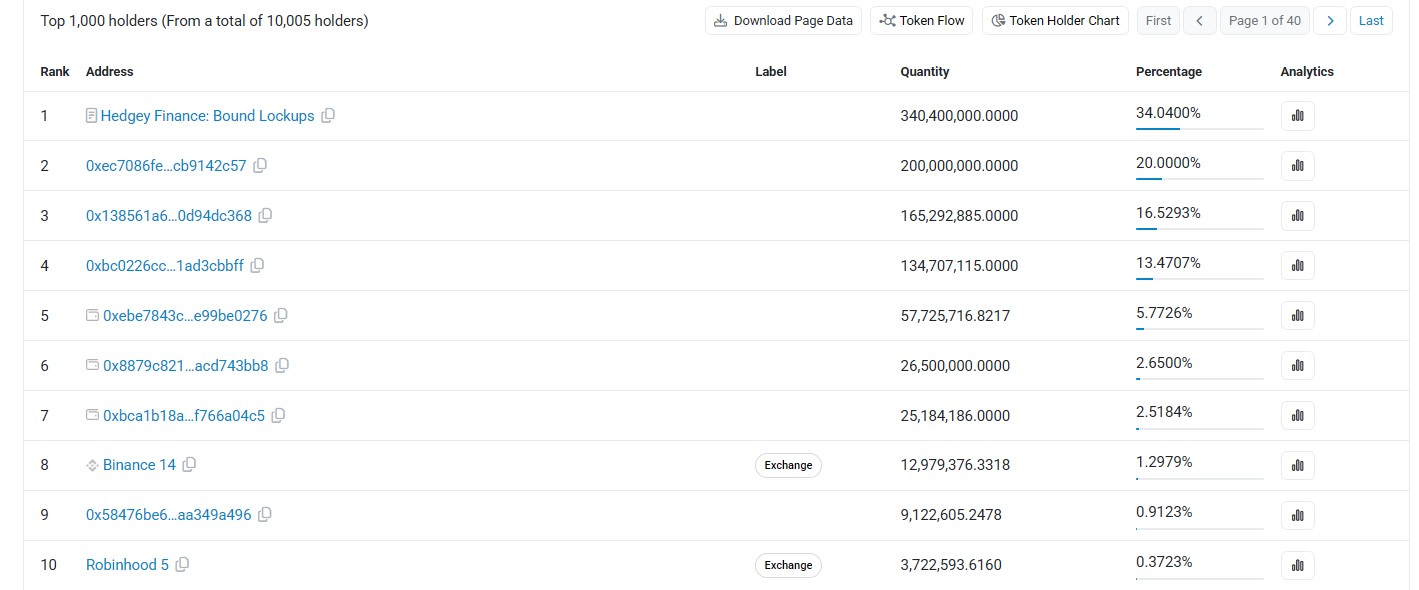
Liquidity and Volume
Liquidity relative to market cap is thin at around 0.01%, even though 24-hour volume has run above $160M. Futures volume is concentrated on OKX ($252M) and Binance ($214M), with smaller flow spread across Bybit, Bitget, MEXC, Bitunix, Gate, KuCoin, and WhiteBIT.
That volume-to-liquidity mismatch means price can move sharply on relatively modest spot order flow, a dynamic also shaped by protocol-level fee mechanics like the ones covered in our Uniswap fee buyback update. Liquidation data on the RE liquidation data tracker backs this up: short sellers took the brunt of the move, losing roughly $1.47M over 24 hours versus $374.78K for longs.
$RE Coin Forecast: Bull, Base, and Bear Scenarios
These are scenario-based estimates from current chart structure, not guarantees or financial advice, framed similarly to the dilution-aware forecasting used in our Ethereum 2026 price outlook.
-
Bull Case: A clean break above $0.7547 opens a path toward the $0.83 zone, with a weekly close above $0.76 needed to challenge the descending-channel resistance seriously. Probability: roughly 30%, contingent on reUSD adoption and points-program momentum continuing.
-
Base Case: Price consolidates in the $0.55–$0.75 range as the overbought 4-hour RSI cools and the market digests the move. Probability: highest, roughly 45%.
-
Bear Case: Momentum fades and price retraces toward the $0.55 support zone, with a deeper test of the $0.45–$0.48 EMA zone possible if the rally proves to be a short squeeze rather than a trend change. Probability: roughly 25%.
RE Price Target: Short-Term Forecast Table
| Timeframe | Bear | Base (RE Price Target) | Bull |
|---|---|---|---|
| 24H | $0.55 | $0.64 | $0.71 |
| 7D | $0.45 | $0.62 | $0.80 |
| 30D | $0.35 | $0.60 | $1.00 |
$RE Price Prediction 2026, 2027, 2030: Long-Term Outlook
Looking beyond the short-term chart, a longer-horizon $RE price prediction from 2026 through 2030 depends heavily on whether reUSD adoption keeps growing and whether the current holder concentration eases as locked supply is released. These figures are directional scenario ranges, not price targets to trade against. RE's entire chart history is only a few months old, so long-range $RE token future price estimates carry far more uncertainty than the 24H–30D table above.
| Year | Bear Case | Base Case | Bull Case |
|---|---|---|---|
| RE Price Prediction 2026 (Year-End) | $0.20 | $0.55 | $1.20 |
| RE Price Prediction 2027 | $0.15 | $0.75 | $1.80 |
| RE Price Prediction 2030 | $0.10 | $1.10 | $3.50 |
Key Risks
-
Overbought short-term momentum. A 4-hour RSI at 75.07 raises the odds of a pullback or consolidation before any further leg higher.
-
Unconfirmed trend reversal. The weekly chart only just broke a multi-week descending channel; one strong candle isn't proof the downtrend is over.
-
Extreme holder concentration. A Gini score of 0.9991 and 99.77% of supply held by just 41 wallets means a small number of holders can move the market significantly.
-
Thin liquidity relative to volume. A 0.01% liquidity-to-market-cap ratio against $160M+ in daily volume means slippage risk on larger orders, a risk profile comparable to sharp drawdowns like the one covered in our Iran truce crypto crash report.
-
Squeeze-driven price action. Heavy short liquidations suggest part of this move was mechanical rather than purely demand-driven, which can reverse quickly once positioning resets, a dynamic also worth watching alongside fresh-launch hype cycles like the one tracked in our Pepeto presale launch countdown.
Glossary
-
RSI (Relative Strength Index): A 0–100 momentum indicator. Above 70 typically signals overbought; below 30 signals oversold.
-
EMA (Exponential Moving Average): A trend-following average weighting recent prices more heavily.
-
FDV (Fully Diluted Valuation): What the market cap would be if all tokens were circulating.
-
Gini Distribution Score: A measure of supply concentration, where scores closer to 1 indicate more unequal distribution among holders.
-
Liquidation: The forced closing of a leveraged position when losses exceed available margin.
Disclaimer: This article is for informational purposes only and does not constitute financial advice. Cryptocurrency markets are highly volatile. Always do your own research and consult a licensed financial advisor before making investment decisions.

















