Ethereum Price Prediction: Tom Lee Buys as ETH Forms Double Bottom


Ethereum price today
ETH is changing hands around $1,761.40, down about 0.7% on the day.
Metric | Value |
Current Price | $1,761.40 |
24h Change | -0.7% |
24h High | $1,827.49 |
24h Low | $1,731.64 |
Market Cap | $212.5 billion |
24h Trading Volume | $16.7 billion |
Circulating Supply | 120.68 million ETH |
Why is $1,800 such an important level for $ETH?
Analysts are watching $1,796 to $1,800 closely. This zone lines up with the 0.8 MVRV Pricing Band, a level that has acted as resistance in past cycles.
A daily close above this band, followed by a hold as support, would be a bullish sign. It could open the door toward the $2,245 realized price level.
There's also a Tom DeMark Sequential resistance line near $1,796, matching the MVRV band almost exactly. Above that, a TD risk line sits around $1,816.
If it clears both levels, the next test would be channel resistance near $1,844. A break there raises the odds of a run toward $2,245.
What does the hourly chart show for ETH?
As per Ali, on the hourly timeframe, Ethereum flashed a fresh TD Sequential buy signal. Traders are watching $1,750 as the line in the sand.
Holding above $1,750 could support a bounce back toward $1,800. Losing that level would invalidate the short-term bullish setup, according to chart watchers.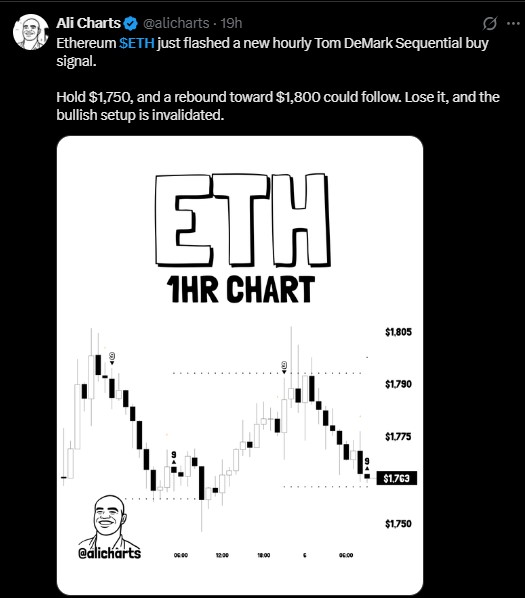
Is Ethereum still in an accumulation phase?
Javon Marks argues ETH is repeating a pattern seen in past cycles. Price breaks out, then consolidates in a range before the next leg higher.
This current sideways range, which has followed the last all-time high, may fit that same pattern. If history repeats, targets mentioned include $5,000, $8,500, and even $12,000 or higher.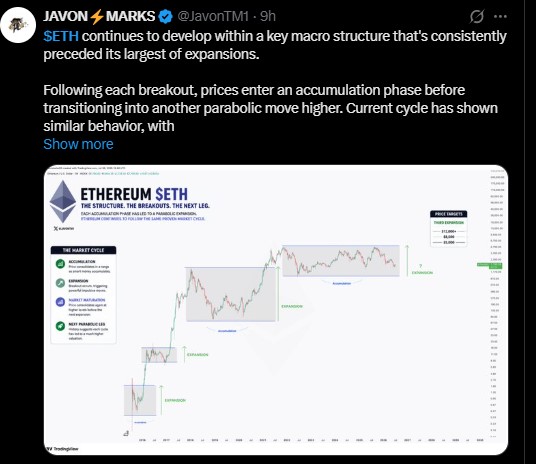
These numbers are speculative and tied to chart patterns, not guarantees. Markets don't always repeat past behavior.
Level | Price | Meaning |
TD Sequential support | $1,750 | Short-term line to hold |
0.8 MVRV Band | $1,796 | Key resistance to flip to support |
TD Risk Line | $1,816 | Secondary resistance |
Channel Resistance | $1,844 | Breakout confirmation zone |
Realized Price | $2,245 | Major upside target |
What else is happening around Ethereum right now?
Vitalik Buterin has raised concerns about how fragmented Ethereum's Layer 2 ecosystem feels for everyday users. He has floated ideas on gas fee structure and shared wallet standards across L2s.
The goal is to make moving between L2 networks feel like using one Ethereum, not many separate chains.
Separately, BitMine added 42,197 ETH worth about $73 million to its holdings. Around the same time, Michael Saylor's firm sold Bitcoin at a loss, offloading 3,588 BTC below cost, resulting in a $54 million realized loss.
Ethereum long-term trendline in focus
On the weekly chart, the altcoin is testing a long-term ascending trendline that has held as support through past cycles.
Rather than breaking down right away, price appears to be stabilizing near this zone. If buyers keep defending it, some traders expect attention to shift back toward the $1,800 to $2,245 range.
This trendline remains one of the more closely watched areas on the weekly chart for now.
What does the weekly Ethereum chart show?
The weekly ETH/USDT chart adds more context to the current setup. Currently, it is trading at $1,760.38, down 1.42% on the week, after opening at $1,785.65.
The week's high touched $1,833.40, while the low came in at $1,728.95. Trading volume sits near 357,100 ETH.
Is Ethereum above or below its key moving averages?
Right now, the altcoin is trading below all four major EMAs on the weekly chart. That's usually a sign of weaker momentum.
The 20-week EMA sits at $2,054.69. The 50-week EMA is at $2,467.39. The 100-week EMA is near $2,629.60, and the 200-week EMA sits at $2,483.83.
Price sitting under all these averages shows Ethereum is still working through a corrective phase after its 2025 highs near $4,950.
What is the long-term ascending trendline on Ethereum's chart?
A long-term rising trendline, drawn from Ethereum's 2022 lows, currently sits below current price action, close to the $1,600 to $1,650 area.
This trendline has held multiple times over the past few years. Price is now trading well above it, but the gap has narrowed compared to past cycles.
If it falls further, this trendline is one of the levels traders may watch as a potential support zone.
What is the RSI saying about Ethereum right now?
The 14-week Relative Strength Index (RSI) is reading 37.42. That's below the neutral 50 mark and closer to oversold territory.
An RSI in this range often reflects sustained selling pressure. It doesn't guarantee a bounce, but it does show momentum has cooled off compared to earlier in the year.
Ethereum weekly chart summary
Metric | Value |
Current Price | $1,760.38 |
Weekly Change | -1.42% |
Weekly High | $1,833.40 |
Weekly Low | $1,728.95 |
20 EMA | $2,054.69 |
50 EMA | $2,467.39 |
100 EMA | $2,629.60 |
200 EMA | $2,483.83 |
RSI (14) | 37.42 |
$ETH remains in a broader downtrend on the weekly timeframe, even as shorter-term charts point to possible bounce levels near $1,750 and $1,800. The bigger picture will likely depend on whether ETH can reclaim its shorter-term EMAs in the weeks ahead.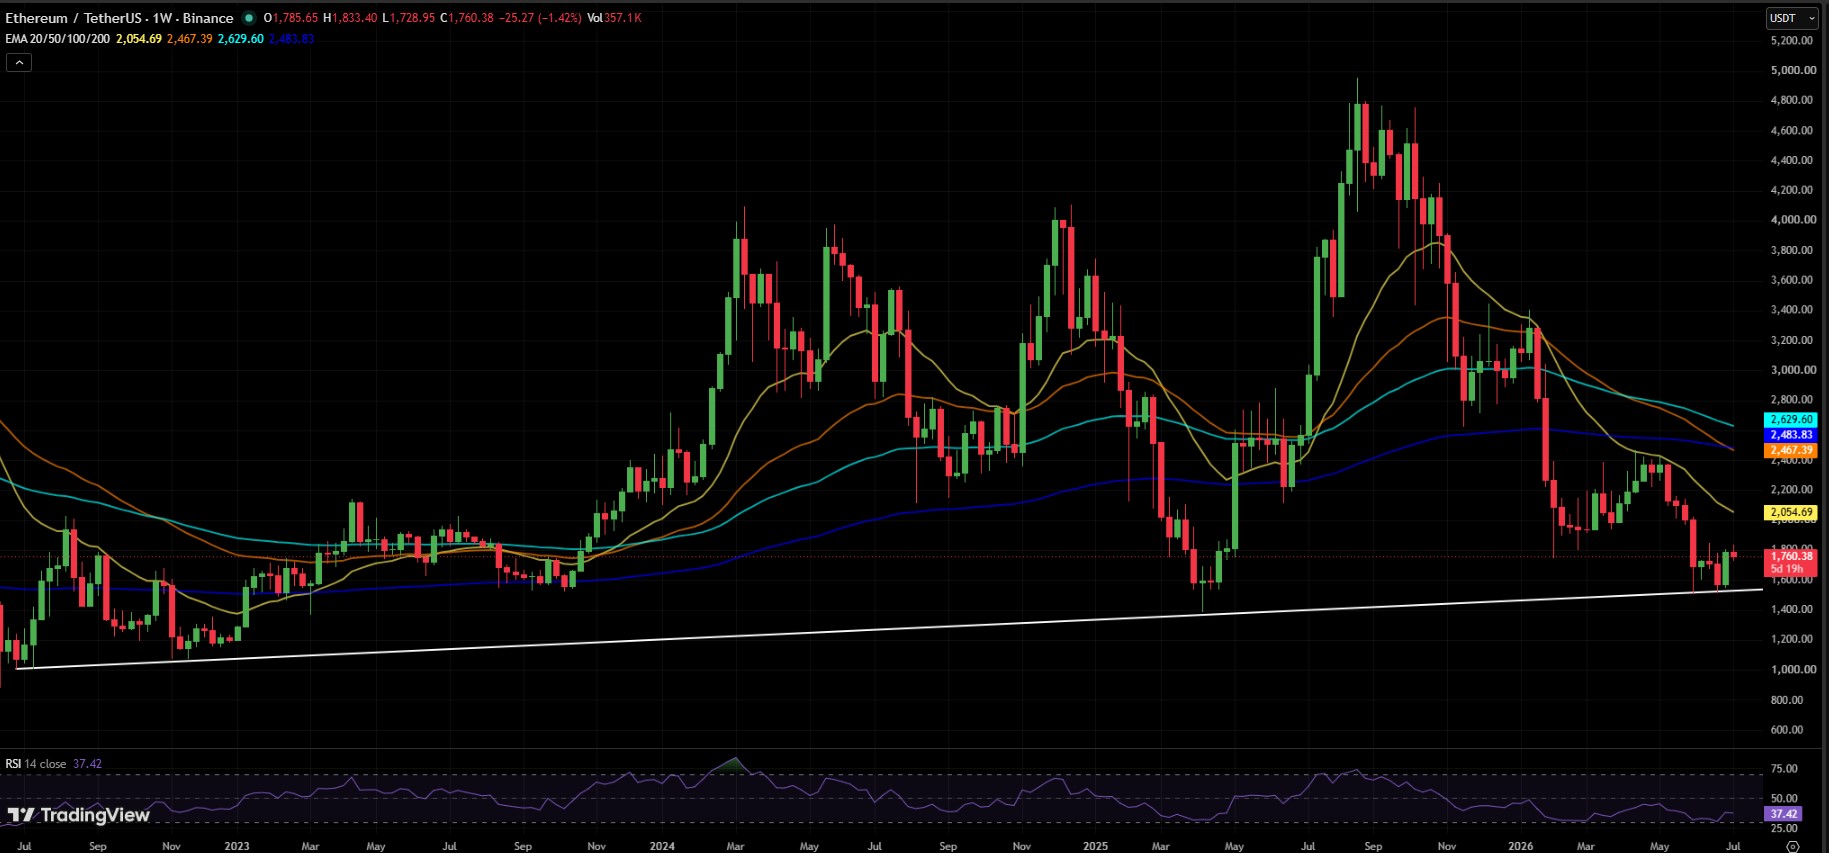
Is Ethereum forming a double bottom pattern?
Ethereum is trying to reclaim a key resistance zone after bouncing twice from the same support area. If buyers hold this level, it could strengthen into a bigger recovery setup.
Chart watchers have noted two separate bounces from a lower support region near the June and July lows. Both reactions came from roughly the same area, suggesting buyers stepped in with some consistency.
What happens if Ethereum holds the mid-$1,700s zone?
Price has now pushed back into a resistance zone around the mid-$1,700s. This area is significant because it once acted as support before the earlier breakdown, and now it's being tested again from below.
A clean move above this zone would point to short-term strength returning to Ethereum. It would also add weight to the idea that the two recent lows formed a short-term double bottom.
The setup isn't confirmed yet, though. If ETH fails to hold above this zone, the bounce could turn into another rejection, pulling attention back to the lower support area.
For now, the reclaim attempt is the main thing to watch. Holding above this zone would support the recovery case, while a rejection would leave Ethereum's structure uncertain heading into the next few weeks.
Disclaimer
This article is for informational purposes only and should not be considered financial or investment advice. Cryptocurrency markets are highly volatile and unpredictable. Always do your own research and consult a licensed financial advisor before making investment decisions.
Also read:











.webp)





