Fusionist Price Prediction: 95% $ACE Rally Meets Clarity Act Delay


Something rattled the charts today, and traders noticed within minutes, but the real story behind this Fusionist price prediction is only starting to come into focus.
Quick Answer
Price: ACE trades near $0.1406, up roughly 95.6% in 24 hours as of 07:30 UTC on August 7, 2026 (source: CoinMarketCap).
Trend: Immediate trend is bullish, with price breaking above a multi-month descending channel on the daily chart.
Key resistance: $0.1533, then $0.1932.
Key support: Daily EMA20 near $0.0834, and the weekly support zone at $0.0619.
Base case: A short-term hold above $0.11 keeps the breakout alive.
Invalidation: A daily close back under $0.0834 would invalidate the bullish setup and open the door to $0.0619.
A Coin Most Traders Had Written Off Just Woke Up
Not every rally makes sense on the first look, and this one is no exception.
ACE spent close to two years grinding lower inside a falling wedge, the kind of chart pattern that quietly bleeds a token's market cap down to almost nothing. Then, without much warning, volume exploded, and the price nearly doubled in a single session. Wallet data shows the token's biggest holders barely moved, which raises an obvious question: who actually bought this dip, and are they planning to sell into the strength?
This Fusionist price prediction walks through the daily and weekly charts, the wallet concentration behind ACE, the liquidation data driving the squeeze, and where price could realistically head from here. We will also connect this move to a bigger story playing out in Washington right now, one that is shaping how every altcoin, ACE included, trades this week. Curious how a delayed Senate vote ties into a token most people had forgotten about?
Key Takeaways
ACE trades near $0.1406, up about 95.6% in 24 hours (CoinMarketCap, 07:30 UTC, Aug 7, 2026).
Daily RSI sits at 73.62, technically overbought after the breakout candle.
Weekly chart shows ACE breaking the top rail of a falling wedge that formed since late 2025.
24-hour liquidations hit $1.39M, with $858.18K of that coming from short positions (CoinGlass).
The top two wallets hold roughly 50.7% of circulating supply combined, a concentration risk worth watching.
Immediate resistance: $0.1533 and $0.1932. Immediate support: $0.0834 (EMA20) and $0.0619.
Table of Contents
What Happened to Fusionist Today
Market Snapshot: Price, Volume, and Market Cap
Daily Chart Technical Analysis
Weekly Chart Technical Analysis
Whale Wallets and Holder Concentration
Liquidation Data and Exchange Volume
Altcoin Market Context and the Clarity Act Delay
Fusionist Price Prediction Scenarios: Bull, Base, Bear
Fusionist Price Prediction Table (2026 to 2030)
Risks to Watch
Glossary
What Happened to Fusionist Today
Here's the thing: ACE did not drift higher slowly. It gapped.
The daily candle opened at $0.111023, pushed up to a high of $0.140763, dipped to $0.109216, and closed near $0.139589, a gain of about 25.72% on the day alone (TradingView, ACEFUSD 1D). Layer that onto the weekly candle, which opened at $0.065062 and is now printing $0.144552, up 122.18% for the week, and you get a token that essentially doubled off its recent low in a matter of days.
We pulled up the trading chart right after the move, and the first thing that stood out was volume. It wasn't a thin, low-liquidity pump. Real size moved through this.
Turns out, the catalyst lines up with a wider shift in exchange volume and short covering, something we will get into in the liquidation section below. But price action like this rarely happens in isolation.
Market Snapshot: Price, Volume, and Market Cap
As of the CoinMarketCap snapshot at 07:30 UTC on August 7, 2026, ACE trades at $0.1406, up 95.61% in 24 hours. Market cap sits at $15.11M, also up 95.32% on the day.
24-hour volume hit $149.39M, a jump of 1,217.19%. That puts the volume-to-market-cap ratio at 1,017.47%, meaning trading volume is more than ten times the entire market cap. That's an extreme reading.
Fully diluted valuation stands at $20.65M. Total supply is 146.3M ACE against a max supply of 147M, with 107.61M ACE currently circulating. Holder count sits at 13,750 wallets, and CoinMarketCap's profile score for the project reads 66%.
Context matters here. ACE hit an all-time high of $17.95 back on December 18, 2023, meaning the current price sits about 99.26% below that peak. But it also just printed a fresh all-time low of $0.06184 on July 19, 2026, only 19 days ago, and today's price is up 114.99% from that low. This is a coin trying to claw back from the bottom, not one making new highs.
Daily Chart Technical Analysis
On the 1D chart, ACE just broke above the upper boundary of a descending channel that had capped price since roughly February 2026. The EMA20 sits at $0.083390, well below the current price, which confirms short-term momentum has flipped upward.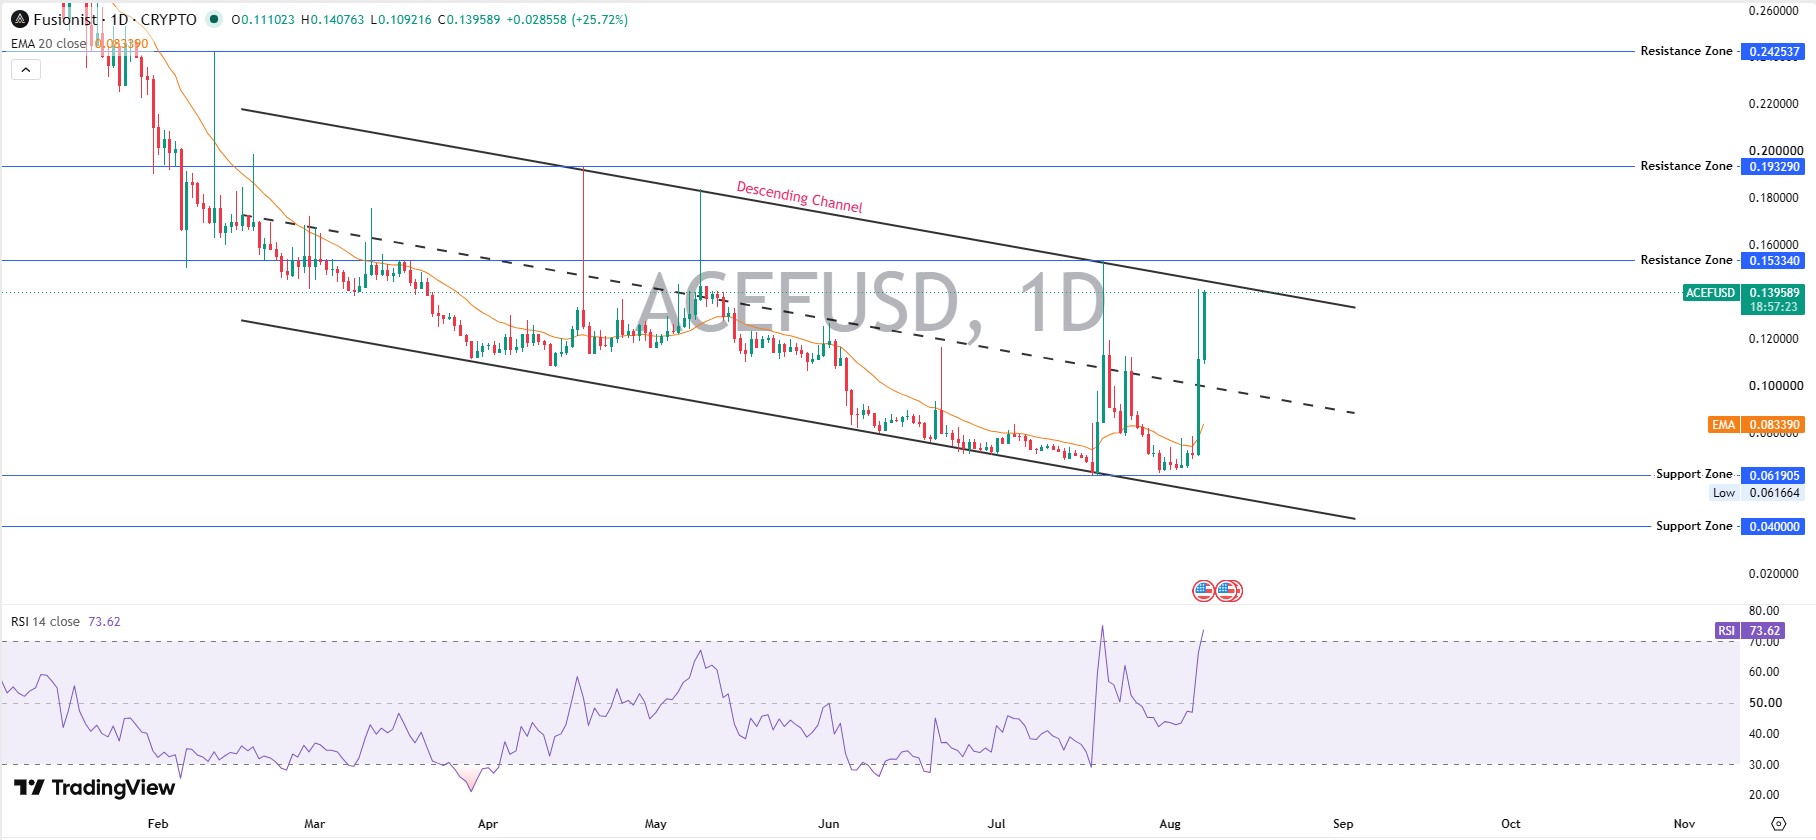
Momentum and RSI
RSI (Relative Strength Index, a momentum gauge that reads overbought above 70 and oversold below 30) sits at 73.62 on the daily. That's overbought territory. It doesn't guarantee an immediate pullback, but it does mean chasing the candle at these exact levels carries more risk than buying a retest.
Resistance and Support Levels
Immediate resistance sits at $0.153340, a zone ACE has rejected from before. Above that, $0.192900 and then $0.242537 mark the next ceilings. On the downside, the EMA20 near $0.083390 is the first line of support, with a deeper support zone at $0.061905 and then $0.040000.
Invalidation
If ACE closes a daily candle below $0.0834, the breakout thesis weakens. A close below $0.0619 would invalidate it outright and point back toward the wedge lows.
Weekly Chart Technical Analysis
Zoom out to the weekly timeframe, and the picture gets more interesting. ACE has been carving a falling wedge since roughly March 2025, a pattern that typically resolves upward when volume confirms the breakout, which is exactly what happened this week.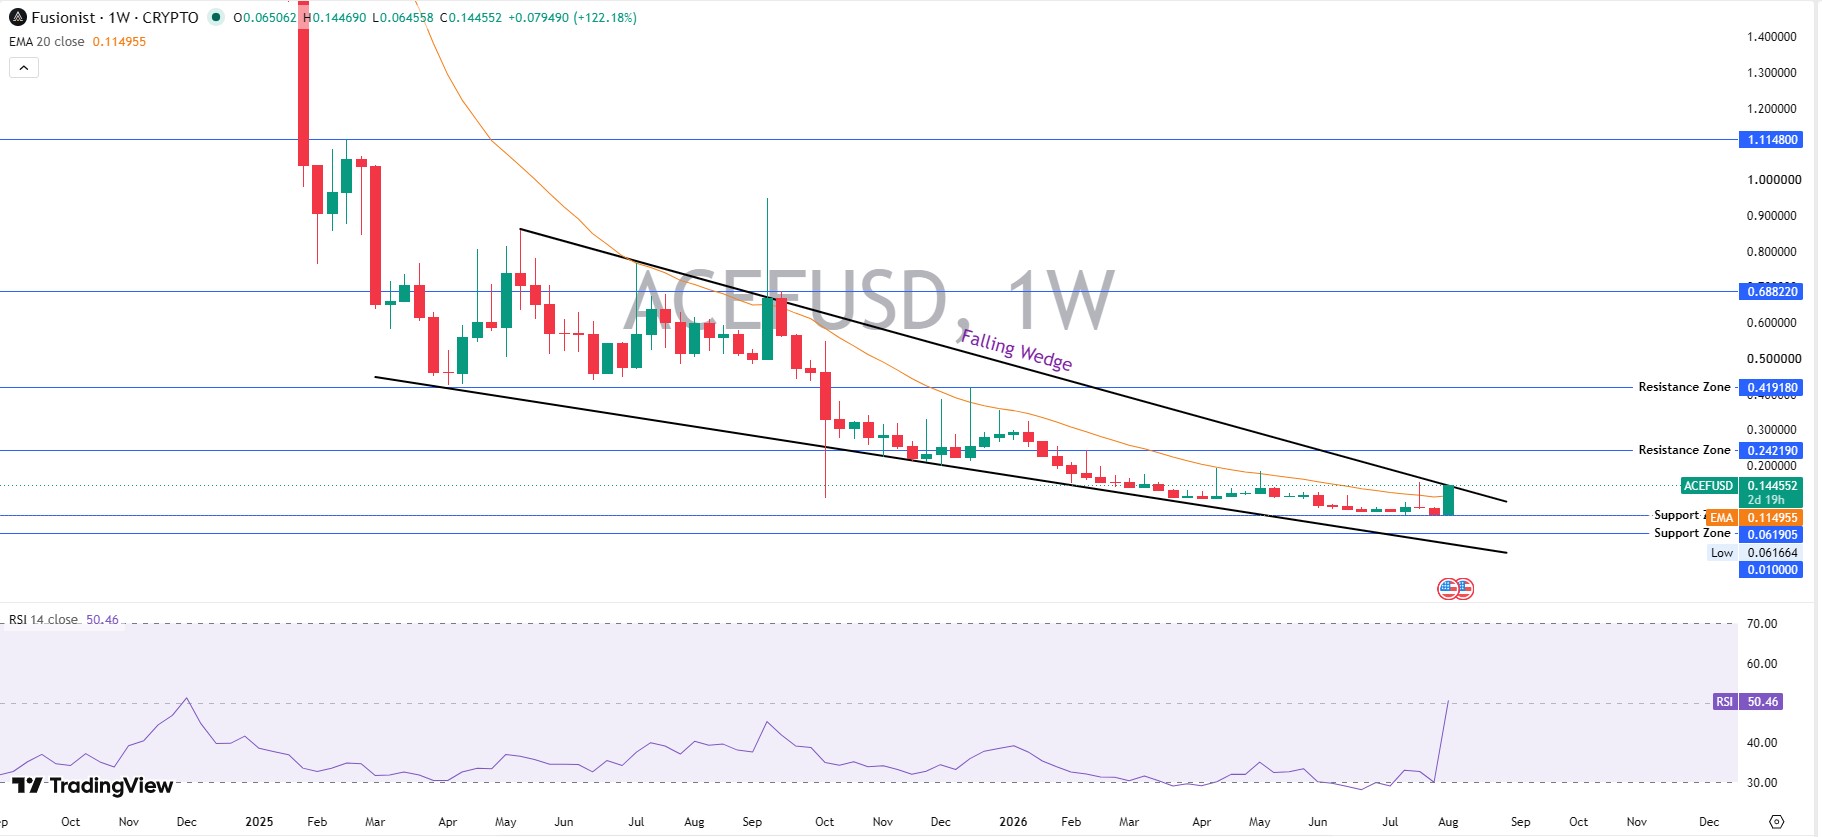
Weekly Momentum
Weekly RSI reads 50.46, right at the midline. That's a meaningful contrast to the overbought daily RSI. It tells us the bigger trend still has room to run before it gets stretched, even though the short-term candle looks hot.
Weekly Structure
The weekly EMA20 sits at $0.114955, now acting as support rather than resistance, a shift that only happens after a real trend change. Resistance overhead sits at $0.242190 and then $0.419180, both a long way from the current print.
And that gap between price and the higher resistance zones is exactly why this move has room, assuming buyers defend the breakout on lower timeframes.
Whale Wallets and Holder Concentration
Wallet concentration is where this Fusionist price prediction gets cautious.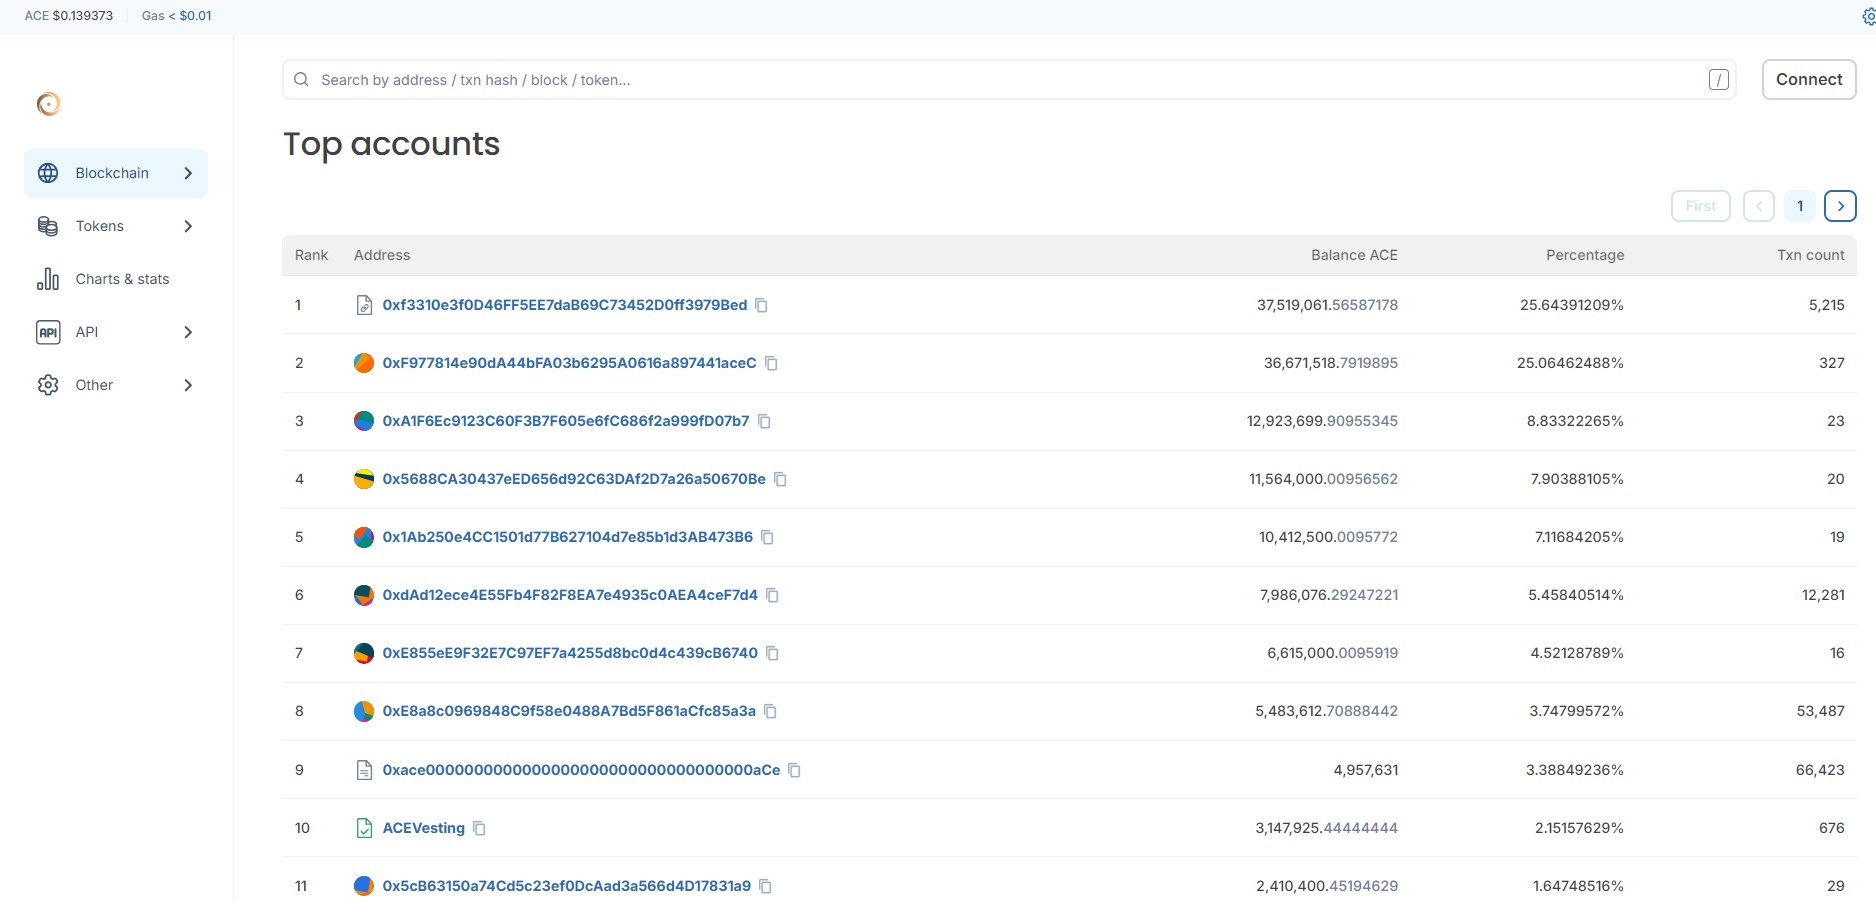
Data pulled from the Endurance chain explorer shows the top two wallets alone control about 50.7% of circulating ACE combined, 25.64% and 25.06%, respectively. Neither is clearly labeled, so we're treating both as unidentified large holders rather than confirmed exchange or team wallets.
Further down the list, one address (0xace...0aCe) holding 3.39% appears to be a vanity contract address rather than an active trading wallet. A wallet explicitly labeled ACEVesting holds 2.15%, consistent with a token release schedule rather than open-market activity. Several mid-tier wallets show transaction counts in the tens of thousands, most notably one wallet with 53,487 transactions holding 3.75%, a pattern that usually points to exchange-linked activity rather than a single retail holder.
Basically, when two wallets control half the supply, a coordinated sell would hit price fast. That's not a reason to panic. It's a reason to size positions with that risk in mind.
Liquidation Data and Exchange Volume
This part reads like breaking news, because it basically is.
In the past 24 hours, $1.39M in ACE positions got liquidated. Of that, $858.18K came from short sellers and $535.57K from longs, based on CoinGlass data. In just the last 12 hours, liquidations totaled $846.62K, again skewed toward shorts at $494.63K.
Shorts got squeezed. Hard.
That squeeze explains a meaningful chunk of today's spike. Traders betting against ACE got forced out as price ripped higher, and their forced buybacks added fuel to the move.
On the volume side, Binance led with $269.94M in Fusionist trading activity, followed by Bybit at $51.59M, Bitget at $22.30M, Gate at $20.60M, and MEXC at $18.20M, with smaller volume also flowing through KuCoin, Hyperliquid, BingX, and Bitunix. That kind of spread across major venues suggests this wasn't a single-exchange anomaly.
Altcoin Market Context and the Clarity Act Delay
Here's where it gets interesting for the wider altcoin market, and it matters for anyone running a Fusionist price prediction this week.
The U.S. Senate will not vote on the Clarity Act, the market structure bill meant to settle SEC and CFTC jurisdiction over crypto, before its summer break. That vote has slipped to September or later, and prediction markets now put year-end passage odds around just 15%. This regulatory delay has weighed on large-cap alts, with XRP down roughly 5.5% on the week, leading losses, while Bitcoin and Ethereum only slipped slightly. You can track how that story is developing in ongoing Clarity Act coverage.
And that's what makes ACE's move stand out. While regulatory uncertainty pressured majors, a small-cap altcoin rallied against the grain on wallet-specific and technical catalysts rather than macro news. That divergence won't last forever, though. If broader risk appetite fades further on delayed Fed policy clarity, thinly traded altcoins like Fusionist tend to give back gains faster than large caps.
As an altcoin with a sub-$20M fully diluted valuation, ACE also carries the volatility profile typical of this category: outsized moves in both directions, low float relative to trading volume, and price behavior often driven more by wallet flows than by fundamentals. Anyone comparing this setup against other small-cap names can check the broader altcoin news feed for similar patterns playing out elsewhere.
Fusionist Price Prediction Scenarios: Bull, Base, Bear
We don't think it's useful to hand out a single number and call it a forecast. So here are three paths, each with a timeframe, a trigger, and a level that proves it wrong.
Bull case (7 to 30 days): A daily close above $0.1533 opens the path to $0.1932 and then $0.2425, roughly a 40% to 70% move from the current price. Trigger: sustained volume above the 24-hour average and continued short liquidations. Invalidation: rejection at $0.1533 with a close back under $0.114 (weekly EMA 20).
Base case (7 to 14 days): ACE consolidates between $0.11 and $0.1533, digesting the RSI overbought reading before attempting resistance again. Probability-wise, this is the most likely near-term outcome given the daily RSI sitting at 73.62.
Bear case (7 to 30 days): A failed retest of $0.1533 combined with fading volume sends price back to the $0.0834 EMA20, and a break there targets $0.0619. Trigger: broad altcoin weakness tied to the delayed Clarity Act timeline or a large wallet distributing strength.
None of these are guarantees. Treat them as scenarios, not promises.
Fusionist Price Prediction Table (2026 to 2030)
Timeframe | Bear Case | Base Case | Bull Case |
7 Days | $0.083 | $0.115 | $0.153 |
30 Days | $0.062 | $0.135 | $0.193 |
End of 2026 | $0.045 | $0.180 | $0.320 |
2027 | $0.030 | $0.220 | $0.550 |
2030 | $0.020 | $0.300 | $1.000 |
These figures are scenario estimates built from current chart structure and supply data, not guaranteed price targets. Longer-dated numbers carry wide uncertainty and should be treated accordingly.
Risks to Watch
Let's be direct about what could go wrong.
Whale concentration remains the biggest single risk, with just two whales controlling roughly half of the circulating supply. Vesting unlocks add supply pressure over time, based on the ACEVesting wallet still holding over 3.1M tokens. And the coin's volume-to-market-cap ratio above 1,000% signals speculative, fast-money trading rather than steady accumulation, which can reverse just as quickly as it appeared.
Macro risk applies too. A further delay or failure of the Clarity Act could dampen risk appetite across the entire altcoin market heading into September, and low-cap tokens like ACE tend to fall harder than Bitcoin or Ethereum in that kind of environment. For a broader read on how regulation is shaping token listings and exchange access, the exchange listing tracker is worth a look.
Glossary
RSI (Relative Strength Index): A momentum indicator from 0 to 100. An above 70 reading suggests overbought, and a below 30 reading suggests oversold.
EMA (Exponential Moving Average): A moving average that weights recent price more heavily, used here on a 20-period basis.
FDV (Fully Diluted Valuation): What the market cap would be if all tokens, including unreleased supply, were circulating today.
Liquidation: The forced closing of a leveraged trading position when losses hit a threshold, often accelerating price moves.
Falling Wedge: A chart pattern with converging downward-sloping trendlines, which often resolves in an upside breakout.
This Fusionist price prediction reflects data captured at 07:30 UTC on August 7, 2026, from CoinMarketCap, CoinGlass, and the Endurance chain explorer.
For ongoing coverage, the wider crypto news desk will follow how this story develops through the September Senate session, along with the coin events calendar for upcoming unlocks and listings.
Disclaimer
This article is for informational purposes only and does not constitute financial, investment, or trading advice.
Crypto assets, especially small-cap altcoins like Fusionist (ACE), carry high volatility and liquidity risk. Prices can move sharply within minutes, and the scenarios, price targets, and forecast table above are estimates based on available data, not guarantees of future performance.
Wallet concentration, exchange data, and liquidation figures can change quickly and may differ slightly depending on the timestamp of capture. Always verify current data directly from CoinMarketCap, CoinGlass, or the official Fusionist explorer before making any decision.
Do your own research and consult a qualified financial advisor before trading or investing. Neither the author nor the publisher is responsible for any losses resulting from actions taken based on this content.
















