Hashflow Price Prediction: Can $HFT Hold Its 37% Surge?


A quiet DeFi liquidity token just posted one of its biggest daily candles in years, and traders want to know if this move has legs.
Hashflow Price Prediction: Does This Breakout Actually Hold Up?
Something woke up in Hashflow this week. The Hashflow price prediction question is suddenly everywhere, and it's not hard to see why.
HFT ripped higher, volume exploded, and a chart pattern that had trapped this token for years finally gave way. But is this a real trend shift, or just a sharp bounce off a multi-year low?
Here's the thing: charts like this scare off as many traders as they attract. Where does HFT actually stand right now?
For a wider read on how altcoins are trading this week, the price prediction hub is a good starting point.
Key Takeaways
-
HFT trades near $0.03155, up 37.26% in 24 hours (data captured 09:00 UTC, August 7, 2026).
-
Daily RSI sits at 94.76, deeply overbought.
-
Price just broke a multi-month descending channel on the daily chart.
-
Whale wallets control 83.67% of supply, per Etherscan.
-
Bull case targets the 0.0485 zone; bear case revisits 0.0170.
What's Actually Moving HFT Today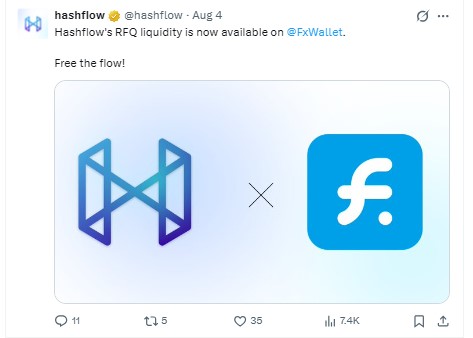
Hashflow, the RFQ-based DeFi liquidity protocol, saw its token jump alongside a fresh integration push. On August 4, the team confirmed that its RFQ liquidity is now live on FxWallet, expanding where HFT liquidity actually gets used.
And that's not nothing. New integrations tend to pull in fresh volume, and volume is exactly what showed up next.
According to CoinMarketCap, HFT's 24-hour volume hit $202.58 million against a market cap near $28.8 million, a volume-to-cap ratio over 700%. That's not organic drift. That's a crowd piling in fast.
Turns out, the market noticed the wallet news before most traders even opened a chart.
Moves like this tend to surface first on trackers covering new exchange listings, well before wider coverage catches up.
Daily Chart Analysis
We pulled up the daily TradingView chart and the first thing that stood out was the size of the breakout candle itself. HFT opened near $0.0300, spiked to $0.0348, dipped to $0.0200, and trades at $0.0318, a 5.30% single-candle range on top of the bigger multi-day move.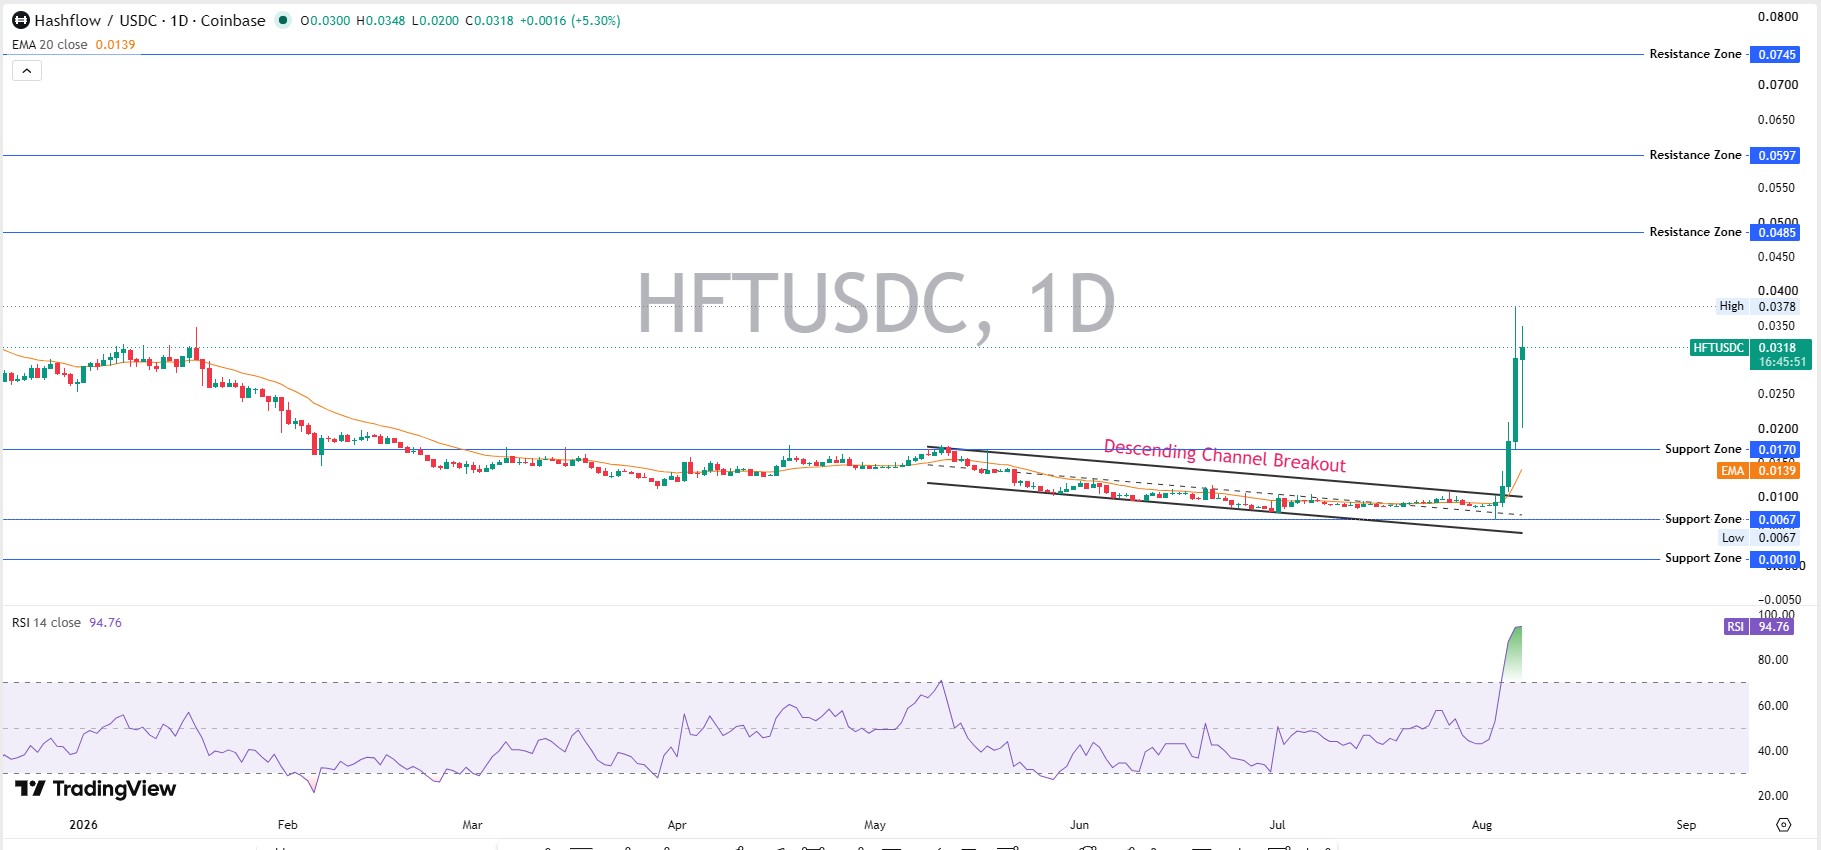
Price broke clean above a descending channel that had capped HFT since May. The 20-day EMA sits at $0.0139, well below spot, confirming the shift in short-term momentum.
Resistance stacks at $0.0170, then $0.0485, then $0.0597, then $0.0745. Support now sits at $0.0170, then $0.0067, then $0.0010.
RSI at 94.76 is extreme. Pullbacks after readings this hot are common, not optional.
Worth checking the upcoming coin events too, since a scheduled catalyst could extend or break this move.
Weekly and Monthly Chart Analysis
Zoom out and the story changes tone. On the monthly view, HFT had been carving a falling wedge since 2022, grinding from an all-time high of $2.58 down toward $0.0067, a 98.86% collapse.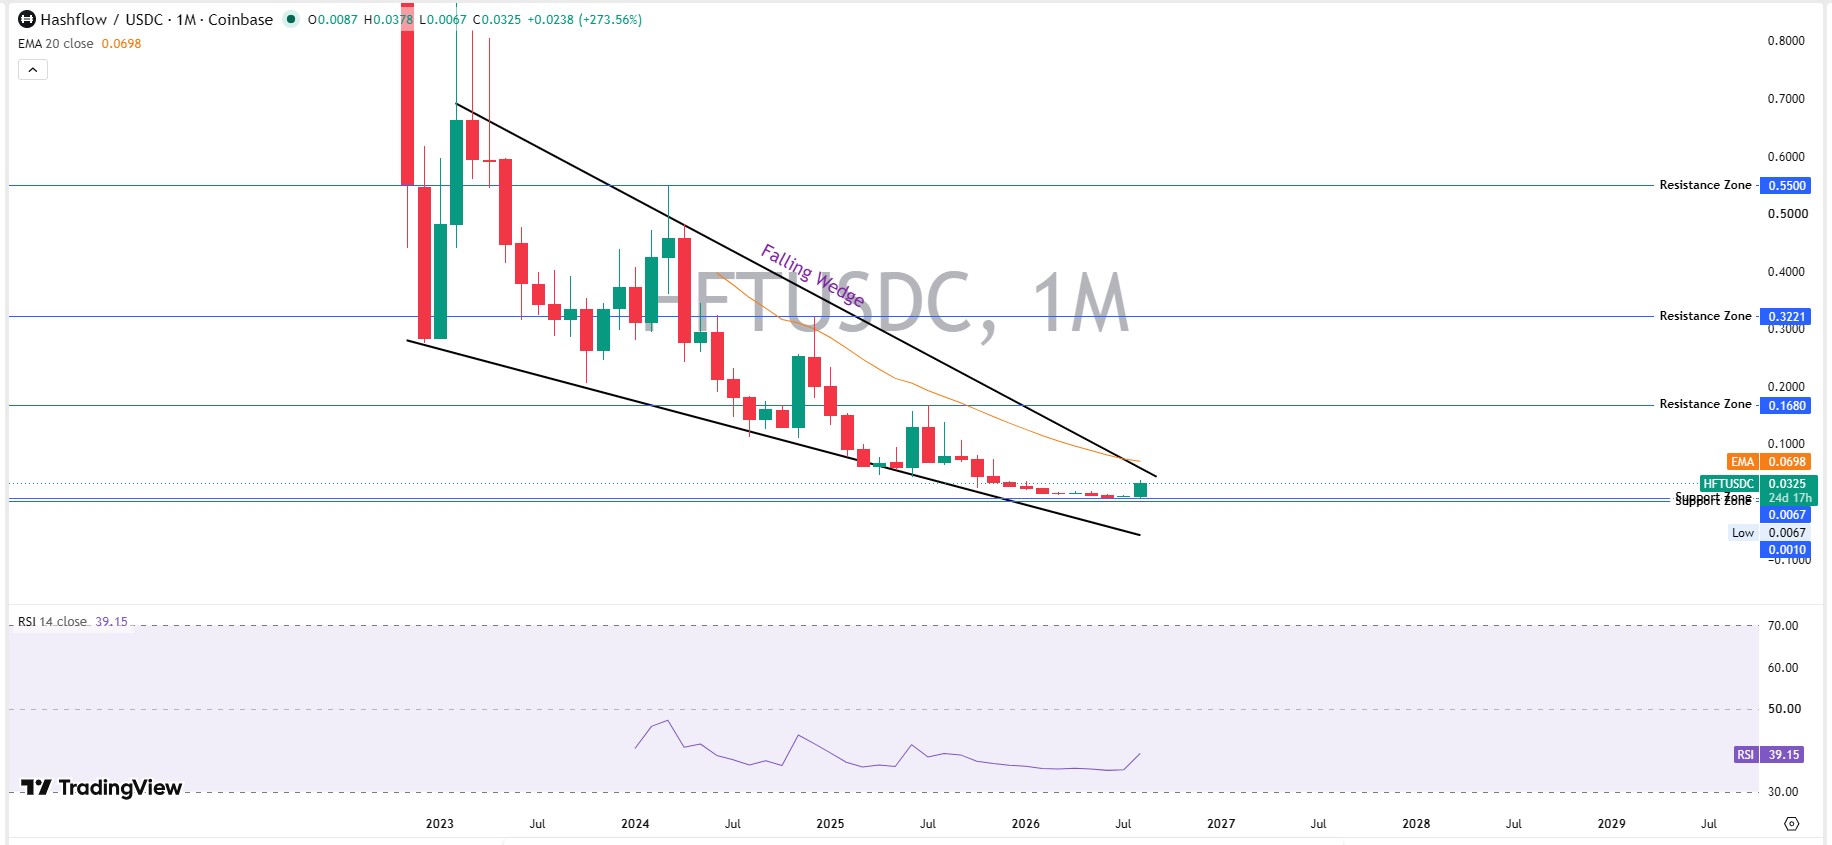
This month's candle is the first real test of that multi-year wedge's upper boundary. Monthly EMA20 sits at $0.0698, still far overhead. Monthly RSI reads 39.15, nowhere near overbought.
That gap between daily and monthly RSI matters. It tells us this move is a short-term spike inside a much longer downtrend, not proof the downtrend is over. Not yet, anyway.
Altcoin Market Context
HFT is an altcoin, not a memecoin, and that distinction shapes how to read this move. Altcoins with real utility, like RFQ-based liquidity routing, tend to react hardest to actual product news rather than pure hype cycles.
Compare that backdrop against where the Bitcoin price outlook currently sits. When the market leader stabilizes, capital often rotates into smaller altcoins chasing bigger percentage swings.
The same rotation pattern shows up around the Ethereum price forecast, and HFT's 37% day fits right into that broader shift.
Tokenomics and Holder Concentration
Here's the part most coverage skips. Per Etherscan, HFT has a 1,000,000,000 max supply and roughly 16,692 holders, and that count has been drifting lower.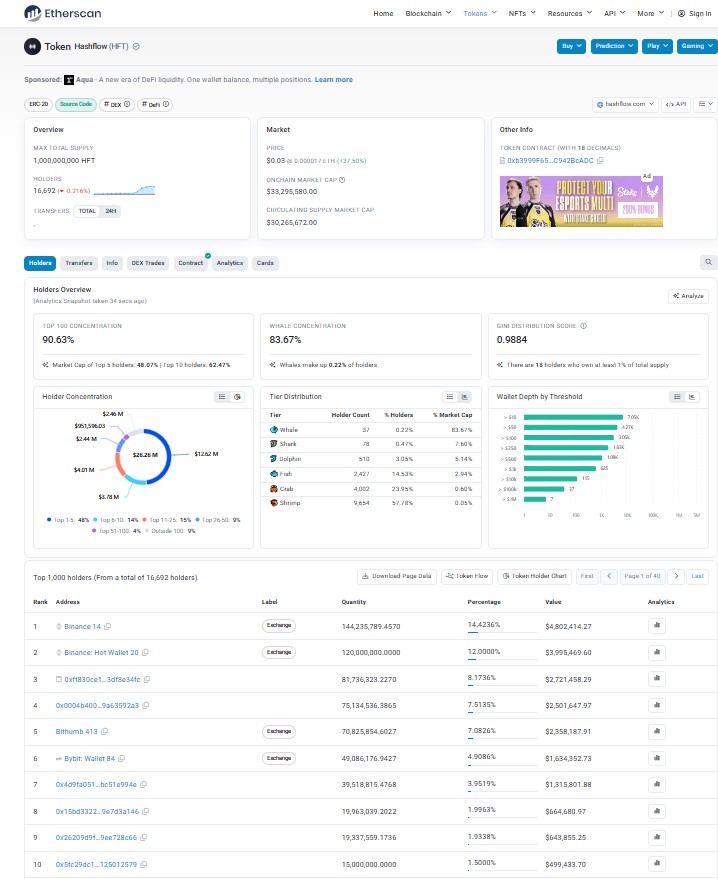
Top 100 wallets hold 90.63% of supply. Whale wallets alone, just 37 addresses, control 83.67%. The Gini distribution score sits at 0.9884, about as concentrated as it gets.
That concentration cuts both ways. It can fuel violent upside when whales accumulate. But it also means a handful of wallets can move this token hard in either direction.
Worth a glance too: active airdrop opportunities sometimes shift holder counts on tokens like this almost overnight.
Liquidity and Derivatives Snapshot
CoinGlass data shows 24-hour liquidations of $3.78 million, split between $1.21 million in longs and $2.57 million in shorts. Short sellers got squeezed harder.
Binance carried the heaviest futures volume at $382.37 million, with Bybit second at $151.42 million. That's real derivatives interest, not a thin, easily manipulated market.
Bull, Base, and Bear Scenarios
| Scenario | 7-Day Target | Probability | Invalidation |
| Bull | $0.0485 | Low-Moderate | Daily close below $0.0170 |
| Base | $0.0170-$0.0250 | Moderate-High | Loss of $0.0067 support |
| Bear | $0.0067 | Low | Sustained close above $0.0318 |
Basically, the base case is consolidation just under resistance while RSI cools off. A clean daily close above $0.0170 as support would strengthen the bull case toward $0.0485.
Macro still matters here too. The Fed rate decision coverage can shift risk appetite across every altcoin, HFT included.
Risks That Could Break This Thesis
Whale concentration remains the biggest risk. Extreme RSI readings often precede sharp pullbacks. And thin market cap relative to volume means slippage can be brutal in both directions.
The setup looks bullish short-term, but this is not a straight line, and treating it like one would be a mistake.
Regulatory shifts add another layer of risk. Recent Clarity Act developments could sway sentiment across DeFi tokens like HFT in the coming weeks.
None of this is financial advice. It's a read of the data available right now, and that data can shift fast.
For more market-moving context, check the latest crypto news before making any trading decision.
Disclaimer
This article is for informational purposes only and does not constitute financial, investment, or trading advice. Cryptocurrency prices, including Hashflow (HFT), are highly volatile, and past performance is not indicative of future results. The scenarios, price levels, and forecasts mentioned above are based on publicly available data from CoinMarketCap, CoinGlass, Etherscan, and TradingView as of the timestamp noted and can change without notice. Always do your own research and consult a licensed financial advisor before making any investment decisions.
















