Hedera Price Prediction: HBAR Confirms Breakout, Eyes $0.15


Hedera price prediction interest is picking up again after Hedera did something it had failed to do on two earlier attempts.
Something changed on the 4-hour chart this time around, the kind of shift that only becomes obvious once you compare how price reacted at each attempt versus the one that finally worked.
Hedera News today is also telling its own story, adding weight to a chart setup that has been building for weeks. Here is the full picture.
Hedera Price Today: Live HBAR Data and 24-Hour Change
Hedera is trading at $0.07967 at the time of this snapshot, up 2.32% on the day after adding roughly $0.0018 in the past 24 hours.
Futures volume across exchanges stands at $87.05 million against spot volume of $28.22 million, showing derivatives traders currently have more influence over HBAR's short-term price action than the spot market.
Open interest is holding at $119.13 million, a moderate level that leaves some room for fresh positioning if this breakout gains traction.
Hedera's market cap sits at $3.49 billion, with a circulating supply of 43.83 billion Hedera out of a total and max supply of 50 billion tokens.
Source: CoinGlass, Hedera market data, accessed September 5, 2026.
Hedera News Today: HBAR Posts a Sharp Rise in On-Chain Activity
The latest Hedera news ties directly into what is showing up on the chart.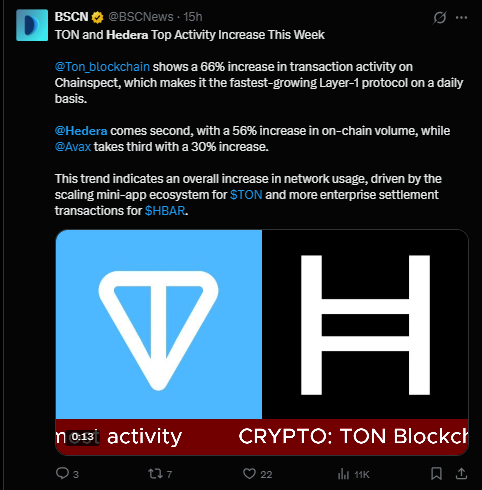
According to BSCN, Hedera has posted a 56% increase in on-chain volume this week, placing it second only to Ton blockchain, which logged a 66% jump in transaction activity on Chainspect data and currently ranks as the fastest-growing Layer-1 protocol on a daily basis.
Avalanche came in third with a 30% increase. BSCN attributes the broader trend to an overall rise in network usage, with Ton's growth driven by its scaling mini-app ecosystem and Hedera's increase linked more to enterprise settlement transactions, a detail that fits Hedera's long-standing enterprise-focused positioning.
For anyone tracking Hedera's latest news alongside the chart, this kind of on-chain growth is exactly the backdrop this breakout attempt is playing out against.
Source: BSCN (@BSCNews) on X, posted roughly 15 hours before this snapshot, September 5, 2026.
Hedera Technical Forecast: HBAR Price Outlook and Breakout Levels
On the 4-hour chart, $HBAR spent several weeks falling along a descending trendline, getting rejected at that line on each of its first two retests.
The third retest told a different story.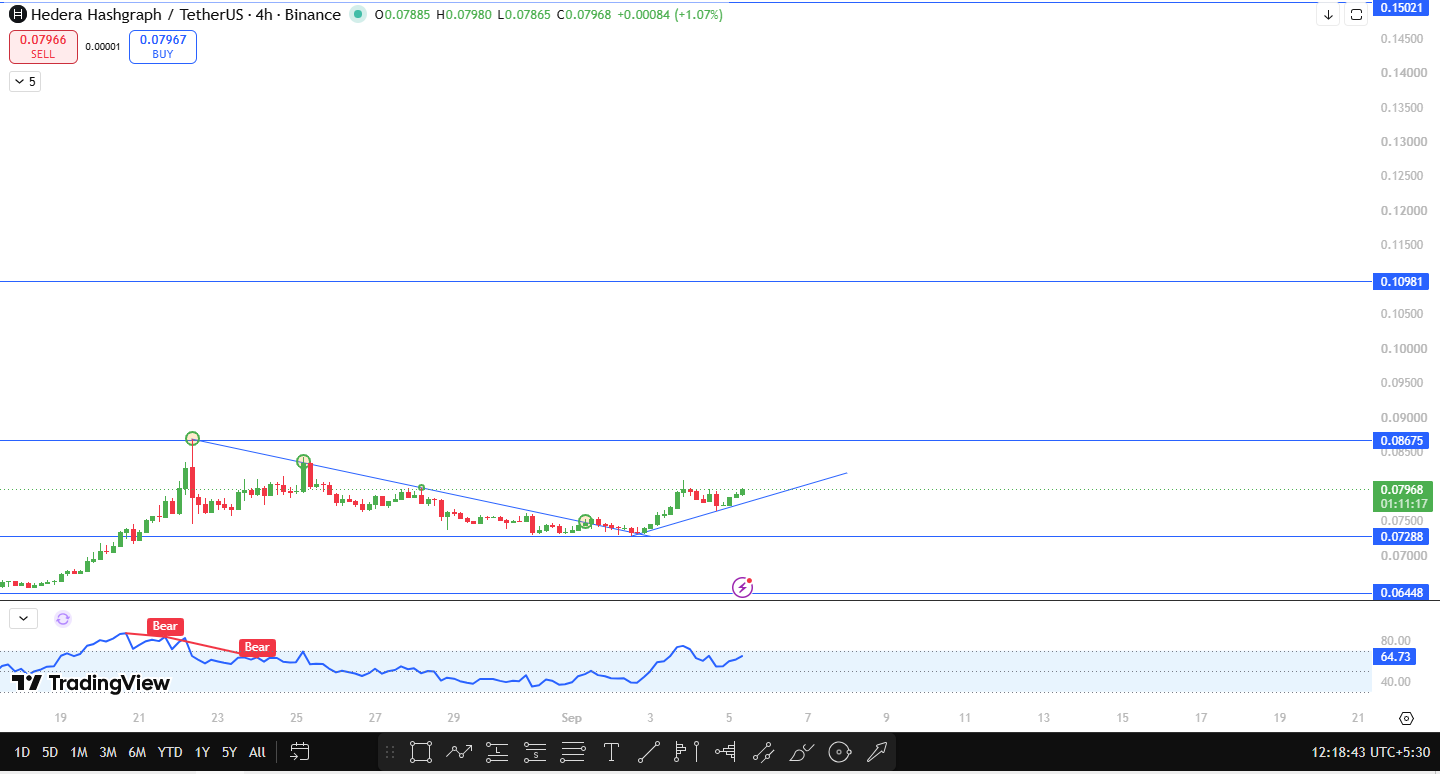
Instead of another rejection, price sustained near that level and eventually pushed through it, confirming a breakout out of the downtrend that had been pressuring HBAR since late August.
Since then, price has been climbing along a new ascending trendline, using it as support on the way back up, which is the core of this HBAR technical analysis.
The next four-hour close is what will decide how far this move can extend.
A close above $0.08675 would confirm the breakout is holding with real conviction, and that would open the path toward $0.10981, roughly 37.8% above the current HBAR price.
Beyond that, $0.15021 comes into view as the next major resistance and a longer-range HBAR price target, close to 88.5% higher than where $HBAR trades today, a level that would mark a return to territory $HBAR has not traded near in some time.
The other side of this HBAR price outlook still needs respect. If price closes below $0.07288, about 8.5% under current price, that would confirm the new ascending trendline has failed and the recent breakout has reversed.
In that scenario, the next support to watch sits at $0.06448, roughly 19.1% below current levels, close to the same zone HBAR was building from before this entire recovery attempt began.
For now, the successful third retest and the shift into an ascending trendline keep the bullish breakout scenario in control, but the next daily close on either side of $0.08675 is what will confirm which direction HBAR actually commits to next.
Source: TradingView chart, Hedera HBAR/USDT pair, Binance, 4H timeframe, snapshot dated September 5, 2026.
HBAR Support and Resistance Levels for This Setup
Level Type | Price | Change from CMP |
Resistance 2 (Major) | $0.15021 | +88.5% |
Resistance 1 | $0.10981 | +37.8% |
Breakout Trigger | $0.08675 | +8.9% |
Current Price (CMP) | $0.07968 | — |
Breakdown Trigger | $0.07288 | -8.5% |
Support 1 | $0.06448 | -19.1% |
Bull, Base, and Bear Case for This HBAR Forecast
In the bullish case, $HBAR holds its new ascending trendline, pushes a four-hour close through $0.08675, and rides the momentum from rising on-chain activity and enterprise settlement growth toward $0.10981 and eventually the $0.15021 zone.
The base case has $HBAR consolidating just under $0.08675 for a while longer, testing that resistance once or twice more without a decisive close through it, essentially letting the breakout attempt build more conviction before committing further.
The bearish case shows up if sellers force a four-hour close under $0.07288. That would undo the recent trendline breakout entirely, and HBAR would likely slide back toward the $0.06448 support zone as the recovery attempt loses its footing.
Hedera Risks to Watch
HBAR's breakout is still fresh, and fresh breakouts on lower timeframes can fail just as quickly as they form, so treating $0.08675 as a confirmation level rather than a guarantee matters here.
The rise in on-chain activity covered in the latest Hedera news is a genuinely positive signal, but network usage data does not always translate directly into sustained price strength, especially if broader crypto sentiment turns risk-off.
General market volatility and any pullback in the wider Layer-1 sector could also weigh on this HBAR price outlook regardless of how clean the chart pattern looks.
Hedera Glosary
Descending trendline: A line drawn along a series of falling highs that acts as dynamic resistance while price trends downward.
Trendline breakout: A close beyond a previously respected trendline that signals a potential reversal of the prior trend.
Open interest: The total number of outstanding derivative contracts that have not been settled, used as a gauge of active leveraged positioning.
On-chain volume: A measure of transaction activity happening directly on a blockchain network, often used as a proxy for real usage and adoption.
Disclaimer
This article is for informational purposes only and does not constitute financial, investment, or trading advice. Cryptocurrency markets are highly volatile, and price predictions are based on technical analysis that can change quickly with new market data. Always conduct independent research and consult a qualified financial advisor before making investment decisions.
1 month ago
Good day everyone, My name is Rayan I was once a victim of $300,000 btc investment scam. I was so devastated at that point because the police won’t look into the matter. I made different enquiries on what to do to recover my lost bitcoin. A friend referred me to this recovery firm who was able to retrieve my stolen bitcoin. I contacted them on (recoverydarek @gmail com) and they came through in less than 24hrs after contacting them, to deliver my funds back to me.


















