Hedera Price Prediction September 2026: $HBAR Outlook


Hype is building around $HBAR after a viral X post claimed Trump called crypto one of the most important industries to invest in, tagging Hedera as one of the rails plays for America's crypto push.
This Hedera price prediction September 2026 update looks at what this means for HBAR, with prices already testing $0.08067 and $0.08993 next in sight.
Market data was checked on August 26, 2026, at 09:44 IST.
Hedera Price Prediction September 2026 Today: Market Overview
Metric | Value |
Price | $0.07837 |
24h Change | -5% |
Market Cap | $3.43B |
Unlocked Market Cap | $3.7B |
FDV | $3.91B |
24h Volume | $97.75M |
Vol/Mkt Cap (24h) | 2.89% |
Total Supply | 50B HBAR |
Max Supply | 50B HBAR |
Circulating Supply | 43.83B HBAR |
Source: Data from CoinMarketCap as of August 26, 2026, at 09:44 IST. Figures may vary slightly across other tracking websites.
Hedera News Update: What Is Being Said About Fair Ordering
A recent post from BSCN explained Hedera's fair ordering design, where transactions are sequenced using a consensus timestamp built from the median time reported by nodes across the network, rather than letting bots pay to jump the queue.
The post also noted a 2024 research paper found a rare edge case where two adjacent transactions landing at the same median time could still flip order, calling it hard in practice but not impossible. 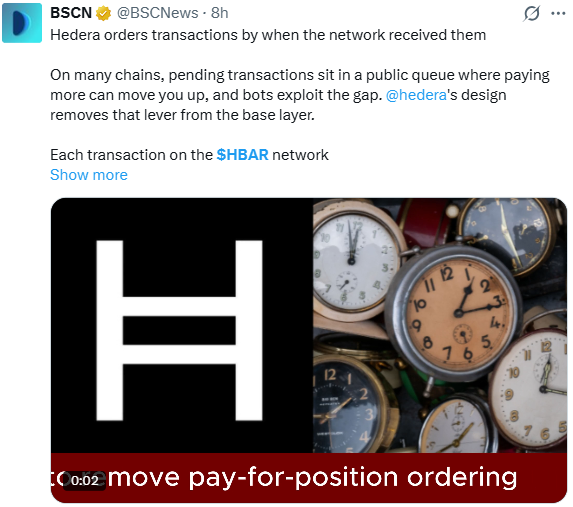
Source: Data From BSCN
This is a technical explainer rather than fresh news, but it is a reminder of why HBAR is often framed as a fairness-focused network.
Hedera Latest Update: Trump Comments and HBAR
A separate post from account X Finance Bull claimed that President Trump called crypto one of the most important industries to invest in and named XRP, XLM, and HBAR as "rails" tied to that view.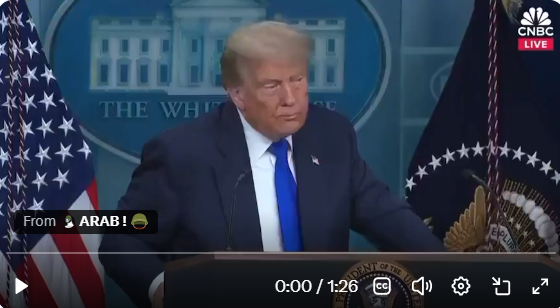
Source: Data From X
Note: This is an unverified social media claim, and CoinGabbar could not independently confirm the quote or its context from an official source.
Traders should treat this as market chatter rather than confirmed news until a primary source verifies it.
Hedera Price Prediction September 2026 Analysis: Chart Levels
Pair: HBAR/USDT · Market: Spot (Crypto) · Exchange: OKX · Timeframe: 1D · Source: TradingView · Timestamp: August 26, 2026, 09:44 UTC+5:30
HBAR is trading at $0.07837, after breaking out of the descending channel that had capped the price since May.
The breakout pushed HBAR into a tight range between $0.07489 and $0.08067, and the price is now pressing against the upper edge of that zone.
RSI (14), a momentum indicator that measures how fast and how far price has moved, sits at 65.89, which is firm without yet being overbought.
A close above $0.08067 would open the door toward the next resistance band near $0.08993.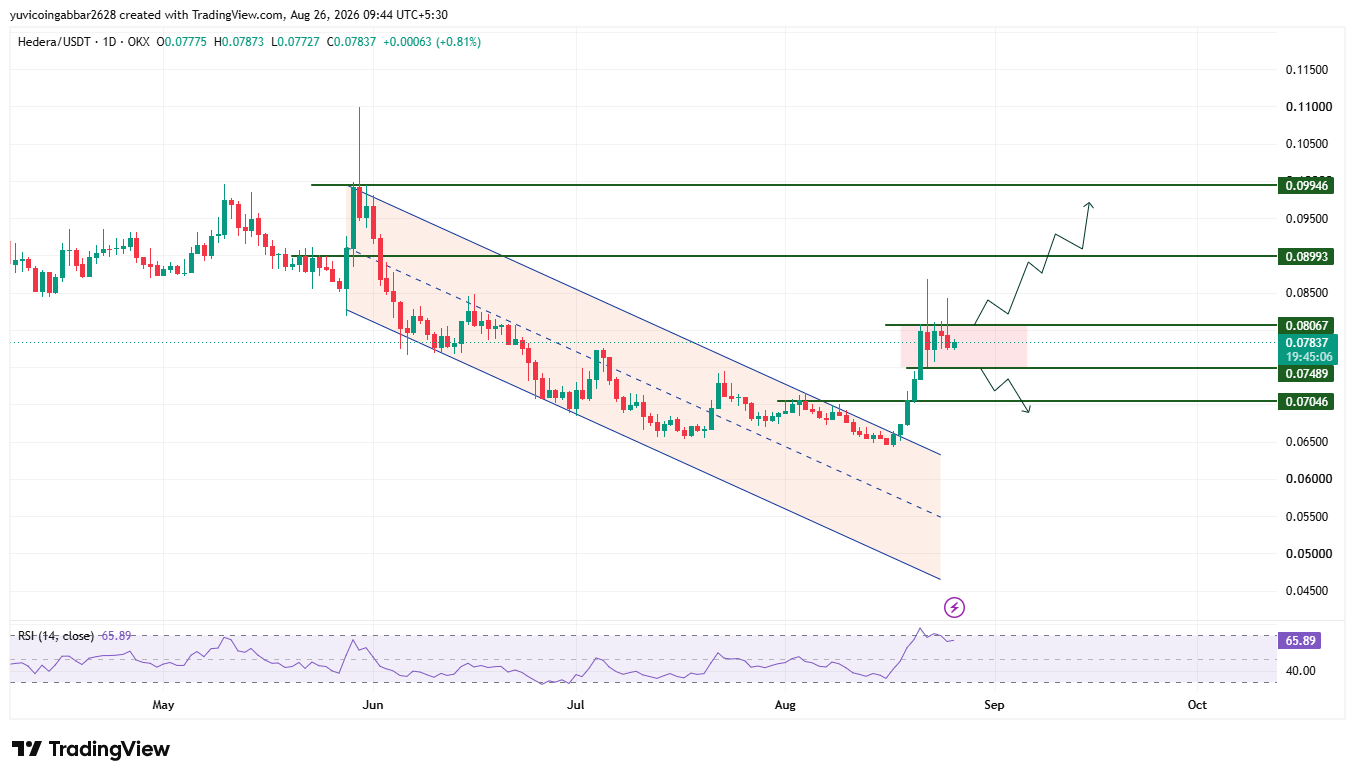
Hedera Price Prediction September 2026: Key Levels
Level Type | Price |
Resistance 3 | $0.09946 |
Resistance 2 | $0.08993 |
Resistance 1 (nearest) | $0.08067 |
Immediate Price Reference | $0.07837 |
First Confirmed Support | $0.07489 |
Deeper Support | $0.07046 |
September 2026 Prediction: Bull, Base and Bear Cases (Hedera)
$HBAR Key Target Levels Bull case: A confirmed close above $0.08067 would confirm the channel breakout is holding, opening a path toward $0.08993 and eventually the $0.09946 zone if buying volume keeps pace.
$HBAR Key Target Levels Base case: HBAR keeps chopping between $0.07489 and $0.08067 for now, reviewing the recent breakout before committing to a clear direction either way.
$HBAR Key Target Levels Bear case: Losing $0.07489 would put the breakout back in question and expose $0.07046, which would suggest the recent move was a short squeeze rather than a trend shift.
Scenario | Trigger | Likely Outcome | Invalidation Point |
Channel breakout confirmed | Close above $0.08067 | Move toward $0.08993 | Close back below $0.07837 |
Range-bound | Price stays $0.07489-$0.08067 | Sideways chop | Break of either boundary |
Channel breakdown | Close below $0.07489 | Drop toward $0.07046 | Reclaim of $0.07489 |
Can HBAR Reach $0.09946?
$0.09946 is the highest resistance marked on the chart.
Getting there would require HBAR to clear $0.08067 first, then push through $0.08993, a two-stage move rather than a single breakout leg.
Hedera Price Prediction September 2026: Expert View
According to CoinGabbar analysts, the channel breakout and firm RSI reading point to genuine buying interest rather than a one-off spike.
The $0.07489 to $0.08067 zone is the key battleground right now: holding it keeps the breakout thesis alive, while losing it would suggest the move was a squeeze.
Broader sentiment around Trump comments and utility narratives may add short-term volatility, but neither is confirmed, so the chart levels remain the more reliable guide here.
Disclaimer: This piece is for informational purposes only and isn't financial advice. The levels and scenarios above are based on technical chart analysis and publicly available data at the time of writing, and crypto markets can move sharply within hours. It's worth doing independent research and considering your own risk tolerance before acting on any of the levels discussed here.
Also read:

















