Hedera Price Prediction: $HBAR Eyes a Major Breakout, 0.1 Level Next?


$HBAR just broke out of a months-long slide and traders are watching closely to see if it holds.
This Hedera price prediction looks at whether HBAR can keep pushing higher from here, with the bullish case staying alive above $0.072810 over the next few sessions, while a break below that level opens the door to a pullback.
Market data was checked on August 31, 2026, at 17:50 IST.
Hedera Price Prediction Today: Market Overview
Metric | Value |
Price | $0.074191 |
24h Change | -1% |
Market Cap | $3.25B (-0.99%) |
Unlocked Mkt Cap | $3.51B |
FDV | $3.71B |
24h Volume | $41.38M (up 29.11%) |
Vol/Mkt Cap (24h) | 1.27% |
Total Supply | 50B HBAR |
Max Supply | 50B HBAR |
Circulating Supply | 43.83B HBAR |
Source: Data from CoinMarketCap as of August 31, 2026, at 17:50 IST. Figures may vary slightly across other tracking websites.
Hedera Price Prediction Chart: Technical Analysis
Pair: HBAR/USD · Market: Spot (Crypto) · Timeframe: 1D · Source: TradingView · Timestamp: August 31, 2026, 15:50 UTC+5:30
HBAR is trading at $0.074191, after breaking sharply out of a months-long downtrend.
Price is now consolidating inside a tight falling flag just below the nearest resistance at $0.077252, with the EMA cluster sitting close by at $0.072624 and $0.073889, acting as support under the current pullback.
The key is for the price to break above the channel and hold the current support, which could pave the way for further upside.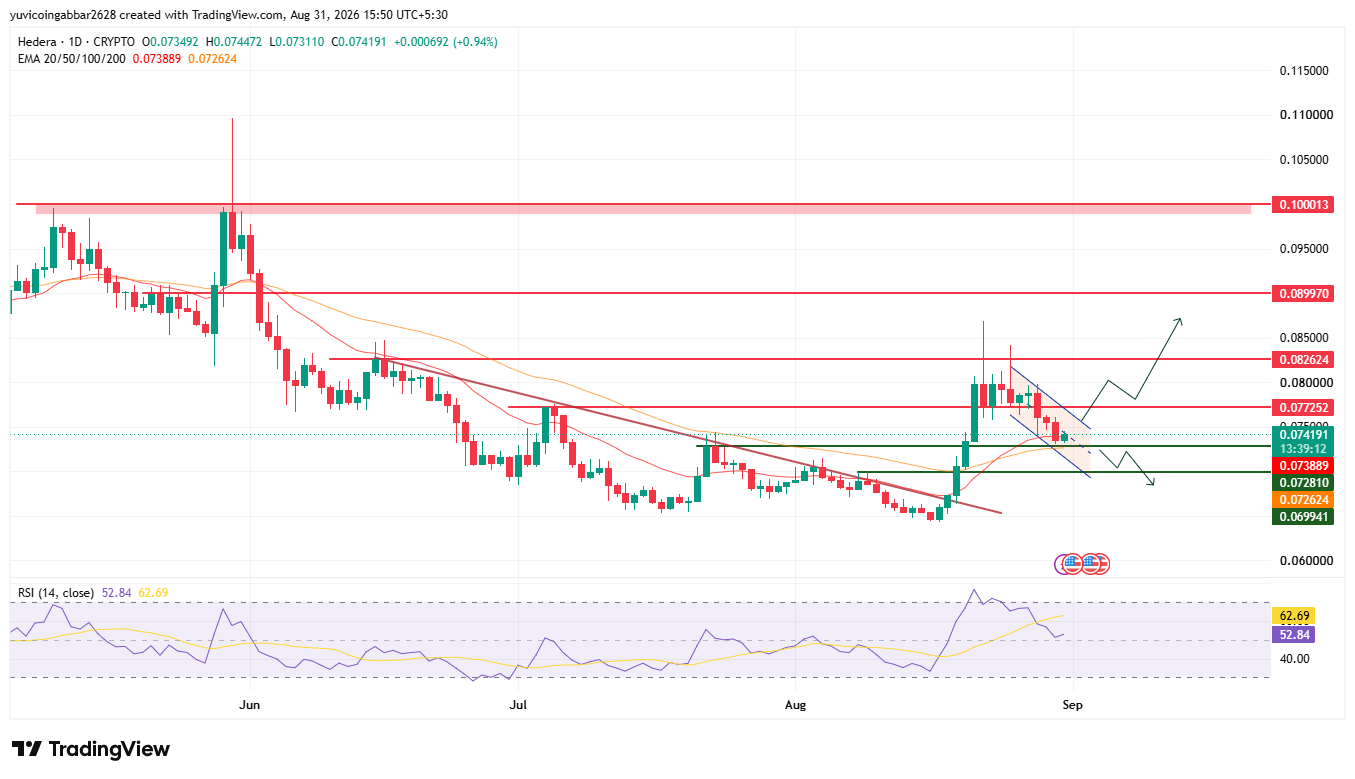
Hedera Price Prediction: Key Levels
Level Type | Price |
Resistance 4 | $0.100013 |
Resistance 3 | $0.089970 |
Resistance 2 | $0.082624 |
Resistance 1 (nearest) | $0.077252 |
Immediate Price Reference | $0.074191 |
First Confirmed Support | $0.072810 |
Deeper Support | $0.069941 |
Hedera Forecast: Bull Case vs Bear Case
Bull case: A daily close above the nearest resistance at $0.077252 would confirm the flag is resolving upward, opening a path toward $0.082624 and eventually $0.089970 if buying pressure returns.
Bear case: Losing the first confirmed support at $0.072810 and the EMA cluster near $0.072624 to $0.073889 would put the breakout in doubt, exposing the deeper support at $0.069941 as the next downside level.
HBAR Price Scenarios: Triggers and Invalidation
Scenario | Trigger | Likely Outcome | Invalidation Point |
Flag breakout (bullish) | Daily close above $0.077252 | Move toward $0.082624, then $0.089970 | Close back below $0.074191 |
Range hold | Price holds above $0.072810 | Consolidation before next push | Break below $0.072810 |
Flag breakdown (bearish) | Daily close below $0.072810 | Drop toward $0.069941 | Reclaim above $0.072810 |
Can HBAR Reach $0.100013?
$0.100013 is the highest resistance marked on the chart, a wide zone that's been capped at price since late spring.
Getting there would take multiple stages: clearing $0.077252 first, then $0.082624 and $0.089970, before HBAR even approaches that level.
Hedera Price Prediction: Expert View
According to CoinGabbar analysts, HBAR's break out of its months-long downtrend is the standout move, and the current pullback into a tight flag looks more like consolidation than reversal so far.
The $0.072810 to $0.077252 zone is the one to watch: holding it keeps the breakout thesis intact.
Disclaimer
This piece is for informational purposes only and isn't financial advice. The levels and scenarios above are based on technical chart analysis and publicly available data at the time of writing, and crypto markets can move sharply within hours, so past patterns don't guarantee future outcomes. It's worth doing independent research and considering your own risk tolerance before acting on any of the levels discussed here.
Also read:
















