Hedera Price Prediction: as HBAR Holds a Critical Support Test.?


The latest Hedera price prediction comes down to a single question: can HBAR hold its ground at current levels, or does the bigger, higher-timeframe downtrend still have the final say?
On the daily chart, HBAR closed at $0.06922, down 1.14% on the session after opening at $0.06998 and swinging between a high of $0.07005 and a low of $0.06905.
That daily candle sits inside a descending channel that stretches back to May, boxed in by resistance at $0.07747 and $0.08514 above, and support at $0.06526 and $0.05878 below.
On the 4-hour chart, price is separately testing a support shelf just below current levels. Two different timeframes, two different stories, and both are converging on roughly the same price right now.
Market Sentiment: Why HBAR Is Moving
Sentiment is split between short-term relief and long-term caution. In the smaller timeframe, buyers have shown real initiative, breaking a descending channel, consolidating, and pushing higher along a fresh trendline before that trendline gave way.
That sequence reflects a market that's trying to build a bottom. But zoom out to the daily chart and the tone changes: HBAR remains inside a broad descending channel that has been intact for months, and Monday's session closed lower by nearly 1%.
The net effect is a market where short-term buyers are active and engaged, but the dominant higher-timeframe trend hasn't yet given them clear confirmation.
Derivatives Analysis: Open Interest, Long/Short Ratio & Liquidations
Open interest currently sits at $85.13 million, down from far higher readings over the past several months, which suggests this move isn't being driven by fresh, aggressive leverage.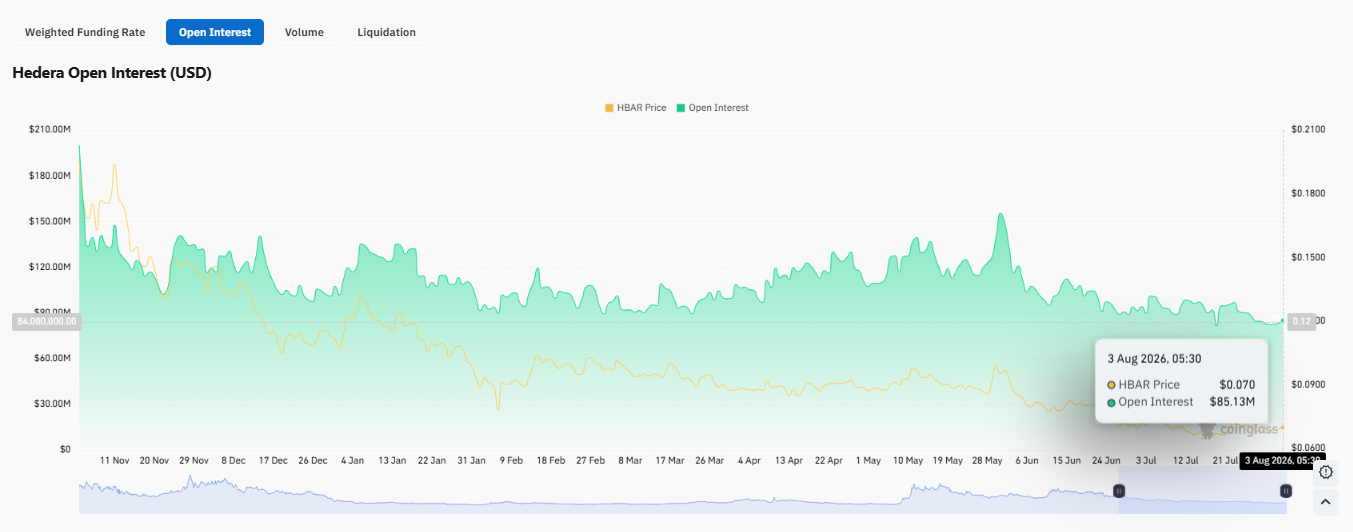
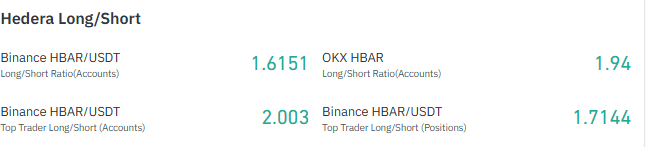
Positioning skews heavily long, though: Binance's HBAR/USDT long/short ratio is 1.6151, OKX shows 1.94, and Binance's top-trader accounts are long at 2.003, with top-trader positions at 1.7144.
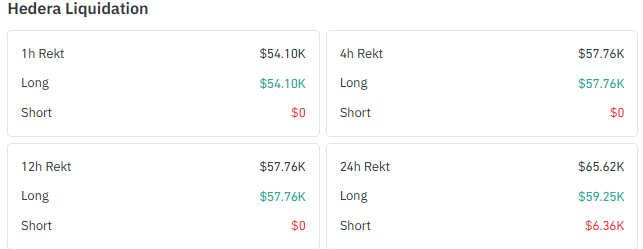
That crowded, long book is already showing stress; 24-hour liquidations total $65.62K, with $59.25K coming from longs versus just $6.36K from shorts.
The 1-hour, 4-hour, and 12-hour windows are even more skewed, with $54.10K–$57.76K in long liquidations and essentially none on the short side, confirming that recent volatility has been squeezing bulls, not bears.
Futures volume is led by Binance ($17.99M), MEXC ($12.10M), BingX ($9.31M), LBank ($8.82M), and Bybit ($5.75M), with OKX, Bitunix, Bitget, WhiteBIT, and KuCoin rounding out the rest.
Data source: coinglass
4-Hour Technical Analysis
$HBAR spent from July 22 sliding lower inside a descending channel, with sellers capping every bounce at its upper boundary.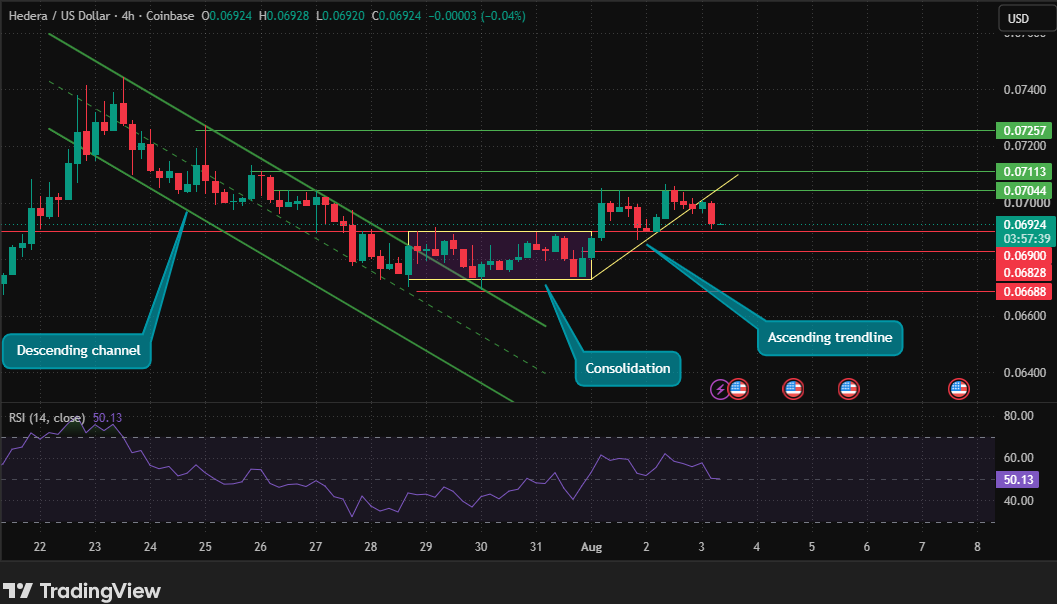
That changed around July 29, when price broke decisively out of the channel, paused into consolidation, and then pushed higher from August 1 along a fresh ascending trendline before that trendline broke on August 3.
The price is now testing immediate support at $0.06924
A failure to hold the support opens the door to $0.06900$0.06688; a hold points to resistance at $0.07044, $0.07113, and $0.07257. RSI reads 50.13 — squarely neutral to bullish, fitting a market that lost its short-term uptrend line but hasn't broken support either.
Daily Technical Analysis
HBAR remains inside a descending channel intact since May. The latest daily candle running at $0.06922, down 1.14%, after opening at $0.06998 and ranging between $0.07005 and $0.06905.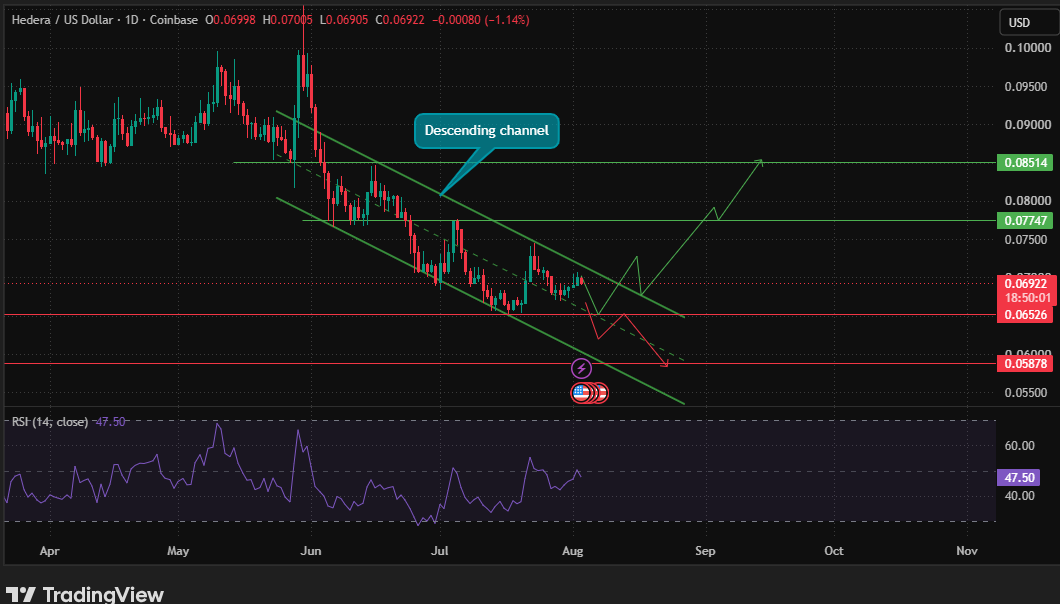
Resistance sits at $0.07747 and $0.08514, while support is marked at $0.06526 and $0.05878.
Price is trading in the middle of this range, near $0.06922, with the chart outlining a possible dip toward $0.06526–$0.05878 before a reversal back up through $0.07747 toward $0.08514, a scenario to watch, not a confirmed move.
Daily RSI reads 47.50, just below neutral. Price hasn't closed above $0.07747 or the channel's upper boundary, so the higher timeframe trend has NOT yet confirmed a breakout.
The descending channel stays dominant, and the 4-hour strength is a move happening inside it, not outside it.
Data source: TradingView
Current Market Sentiment
The 4-hour chart shows a market on the fence trendline broken, support not yet broken, and RSI dead neutral at 50.13.
The daily chart reinforces that caution: price remains inside its descending channel below $0.07747 resistance, with RSI at 47.50, and no breakout has been confirmed. Neither timeframe currently favors a clear directional bias.
Price Prediction
Scenario | 4-Hour Chart | Daily Chart |
Bullish | Holds support at $0.06924–$0.06927 and reclaims the broken ascending trendline, opening a path toward $0.07044, then $0.07113, and $0.07257. | Sustained strength needs to clear $0.07747 first, with $0.08514 as the larger resistance target if the descending channel is genuinely broken. |
Base | Chops between roughly $0.06900 and $0.07044, with neutral RSI supporting a sideways grind rather than a decisive move. | Remains inside the descending channel, between $0.06526 support and $0.07747 resistance. |
Bearish | Support at $0.06924–$0.06927 fails, sending price toward $0.06900, then $0.06828, and $0.06688. | A deeper slide toward the $0.06526 support, and potentially the $0.05878 zone below it, matching the downside path outlined on the chart. |
Analyst View
As per the coingabbar analyst These two timeframes are telling complementary, not contradictory, stories. The 4-hour descending channel breakout was a genuine short-term win for buyers, but it happened entirely inside a daily structure that still hasn't confirmed anything; the price remains well below both the $0.07747 and $0.08514 daily resistance levels.
And the daily RSI at 47.50 shows momentum that's soft rather than turning. That context matters: the trendline break on August 3 looks less like a failed reversal and more like a normal pause inside a bigger downtrend that buyers are still working to overturn.
Right now, sellers retain the structural advantage on the higher timeframe, even though buyers have been the more active side over the past two weeks.
Traders should be cautious about treating the 4-hour strength as confirmation of a larger trend change; it isn't one until the daily chart actually clears $0.07747, let alone $0.08514.
Disclaimer: This analysis is for informational purposes only and does not constitute financial advice. Cryptocurrency markets are volatile, and readers should conduct their own research before making investment decisions.


















