Heima Price Prediction 2026: Can $HEI Hold $0.39 After the Rally?


A coin that had been drifting sideways for weeks just ripped through every short-term ceiling traders had drawn on it. Moves like this tend to split a market into two camps fast: the ones who think it's the start of something bigger, and the ones who think it's a trap waiting to snap shut. So where does this one actually stand right now?
Heima Price Prediction: What the 108% Move Actually Means
Heima price prediction searches are climbing fast, and that's not surprising once you see the chart. HEI, the token behind the Heima cross-chain identity network, tore higher and dragged plenty of sideline traders in with it.
This kind of candle doesn't happen quietly. It never does.
Heima still carries real questions around it. The token trades well below its early 2025 peak, and a handful of exchange wallets hold a large chunk of visible supply.
But the breakout lines up with fresh derivatives activity and a new leveraged product listing, and that combination is worth unpacking properly. We wanted to know if this move has legs. Keep reading for the full breakdown of where HEI could head from here.
Key Takeaways
Here's the Heima price prediction snapshot at a glance, before we get into the charts.
Direction: Short-term momentum is bullish, but daily RSI is deep in overbought territory.
Why it moved: A sharp short squeeze lined up with a new leveraged-token listing from BigONE, per the exchange's own announcement.
Price now: Around $0.393, up roughly 108% in 24 hours, per CoinMarketCap.
Key support: $0.24, then $0.14.
Key resistance: $0.43, then $0.53.
Invalidation: A daily close under $0.24 breaks the near-term bullish thesis.
Data captured August 6, 2026, roughly 18:36 UTC, from TradingView, CoinMarketCap, and CoinGlass.
Coin Overview
Any Heima price prediction has to start with the current snapshot below, since the base numbers shape every level we mention later.
Metric | Value |
Token | Heima (HEI) |
Network | Ethereum (ERC-20), bridged to Heima Network |
Price (current) | $0.393 |
Market Cap | $32M |
Fully Diluted Valuation (FDV) | $39.34M |
24H Volume | $270.46M |
Circulating Supply | 81.37M HEI |
Max Supply | 100M HEI |
Holders (CMC) | 1.9K |
All-Time High | $1.36 (Feb 13, 2025) |
All-Time Low | $0.01821 (Oct 11, 2025) |
Full live figures sit on the Heima market page, and that's the source we pulled this snapshot from.
What Actually Happened
Heima started as Litentry before rebranding into a broader cross-chain identity and account-abstraction project. That backstory matters here, because it's an infrastructure token, not a fresh launch with nothing behind it.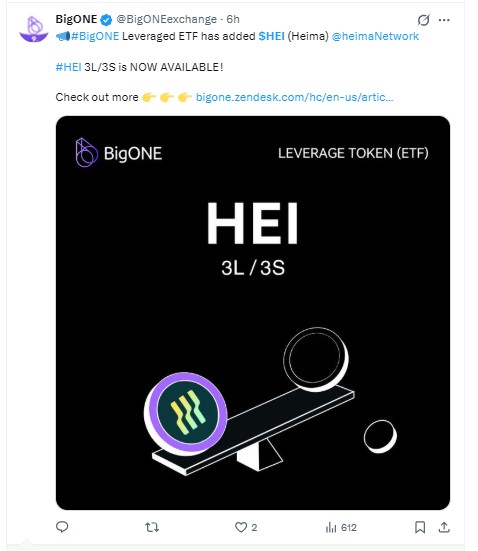
The immediate spark looks derivative-driven. BigONE announced a new 3L/3S leveraged ETF product for HEI, and leverage flowing into a thin order book tends to exaggerate every move, up or down.
That's not the whole story, though. The deeper look at why Heima is under pressure covers the weeks of quiet grinding that came right before this candle.
The setup was already there. The leverage just lit the fuse.
Daily Chart Analysis
On the daily HEIUSDT chart on MEXC, the candle opened at $0.268, ran up to a high of $0.415, and closed at $0.396, a gain near 47% for that single session, per TradingView.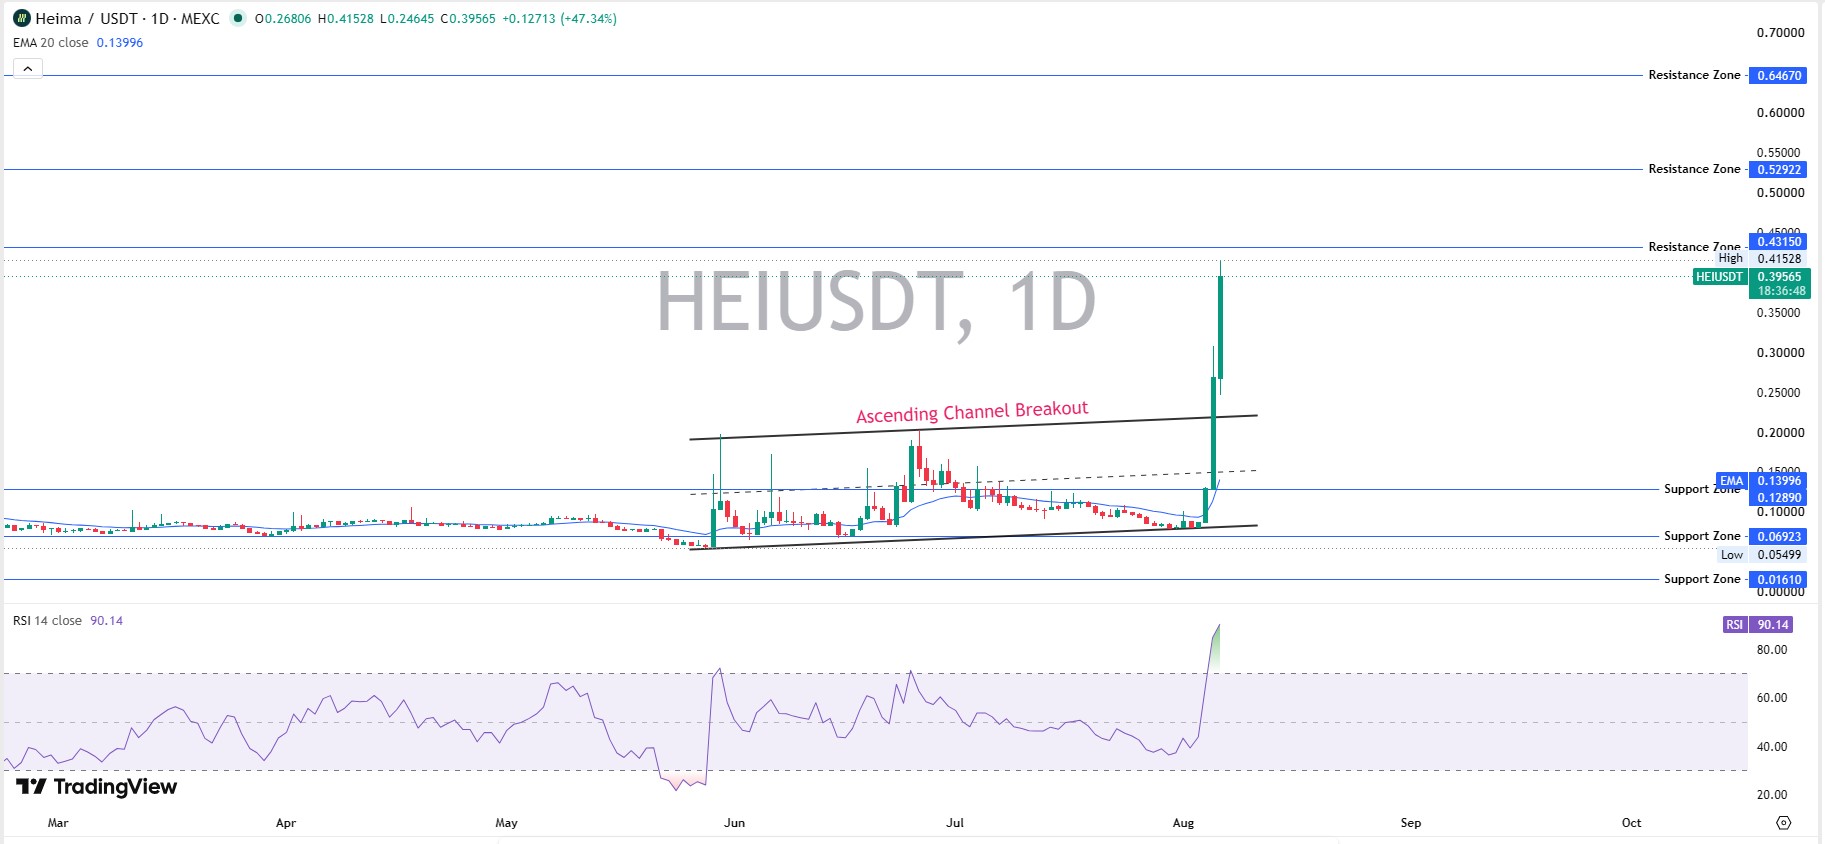
Price cleared an ascending channel that had capped HEI since June, with the breakout candle punching straight through the top of that structure.
Daily RSI, a momentum reading where anything above 70 usually flags overbought conditions, sits at 90.14. That's extreme.
The EMA20 basis sits way down at $0.140, leaving a wide gap under the current price. Gaps like that tend to get partially closed once momentum cools.
Resistance sits at $0.4315, then $0.5292, then $0.6467. Support underneath runs $0.0692, with a deeper shelf at $0.0161 near the token's floor.
Candle structure matters here too. The daily bar closed near its high with a small upper wick, which points to buyers still in control into the close rather than sellers fading the move late in the session.
The next daily close is the level to watch. A close that holds above $0.35 keeps the ascending structure intact, while a close back under the old channel top near $0.24 would undercut the breakout fast.
Weekly Chart Analysis
Zoom out to the weekly chart, and the story gets bigger. The candle opened at $0.081 and printed a high of $0.415, putting this week up roughly 384% so far, per TradingView.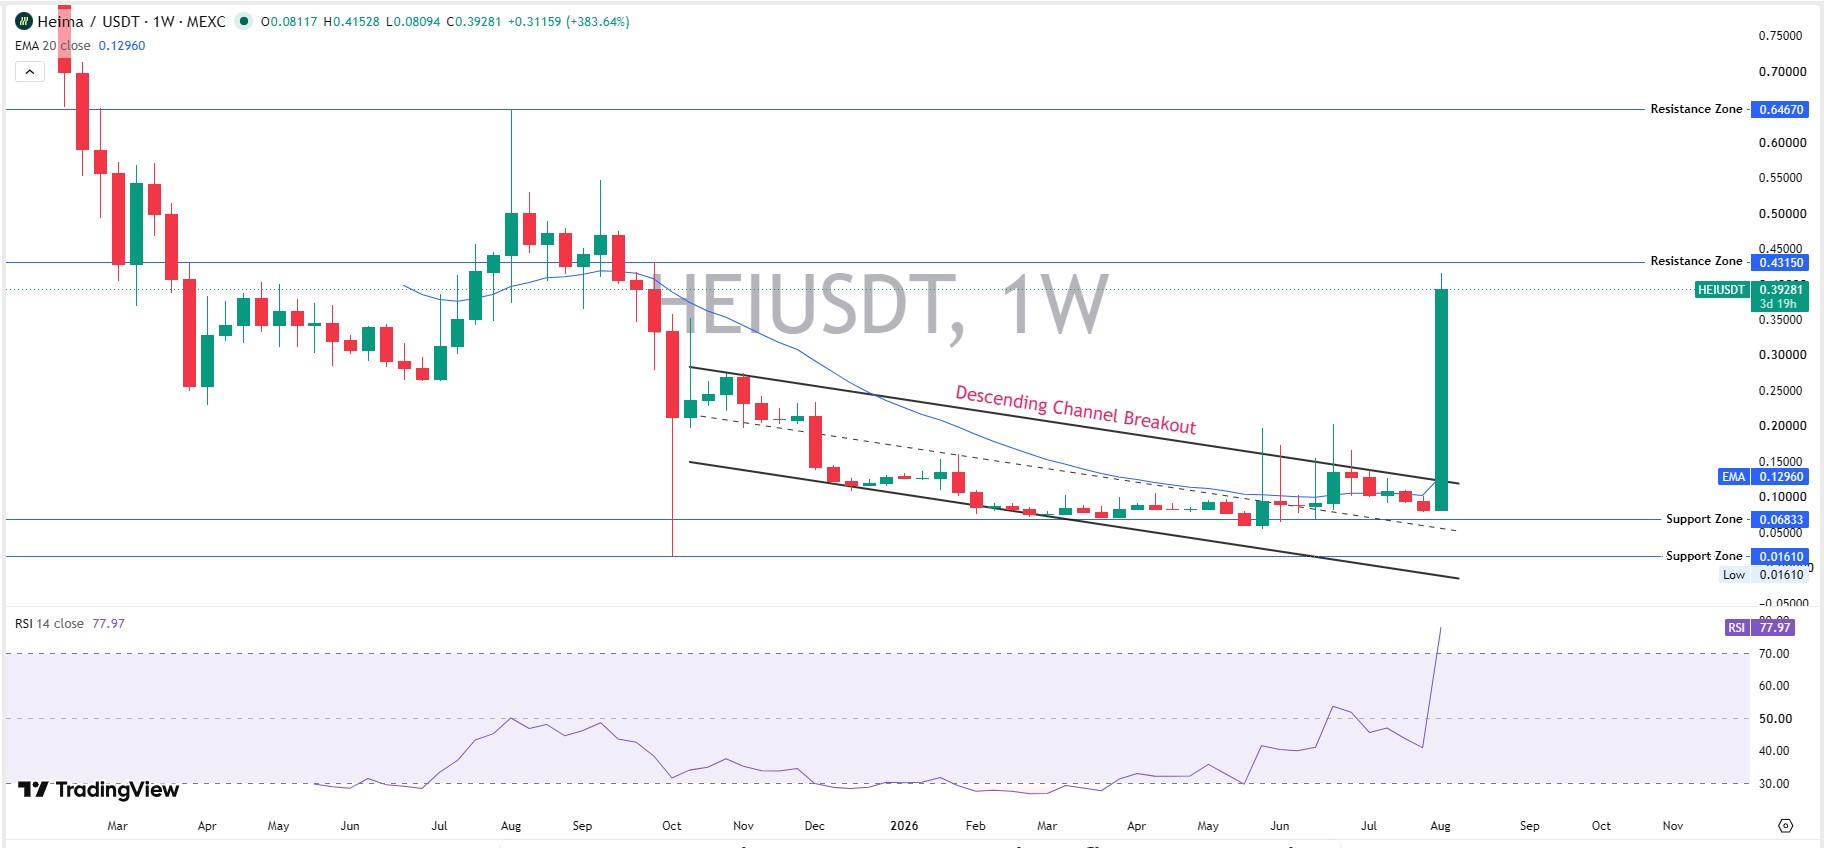
Here's the thing: this weekly candle has not closed yet. The breakout above the multi-month descending channel is real on the chart, but until the weekly bar settles, that breakout isn't confirmed.
The weekly RSI reads 77.97, hot but not the most extreme reading on record for this pair. Weekly EMA20 sits near $0.1296, again well below spot.
A close above the current level into next week would support the bullish case. And a fade back under that descending channel line before the close would flip the signal.
Derivatives and Liquidations
Short sellers took the brunt of this move. CoinGlass data shows 24-hour liquidations near $3.95M, with roughly $3.40M of that coming from short positions getting force-closed.
The 12-hour window alone carried $2.76M in liquidations, over $2.55M of which were shorts. That ratio doesn't happen without real short interest getting caught wrong-footed.
Binance carries the bulk of futures volume at $754.14M, with Bitunix, Bybit, MEXC, and Gate trailing behind, according to CoinGlass's exchange data.
Whale Concentration and Holder Data
We pulled the on-chain holder breakdown from Etherscan, and it's concentrated, though not in the way you'd first assume.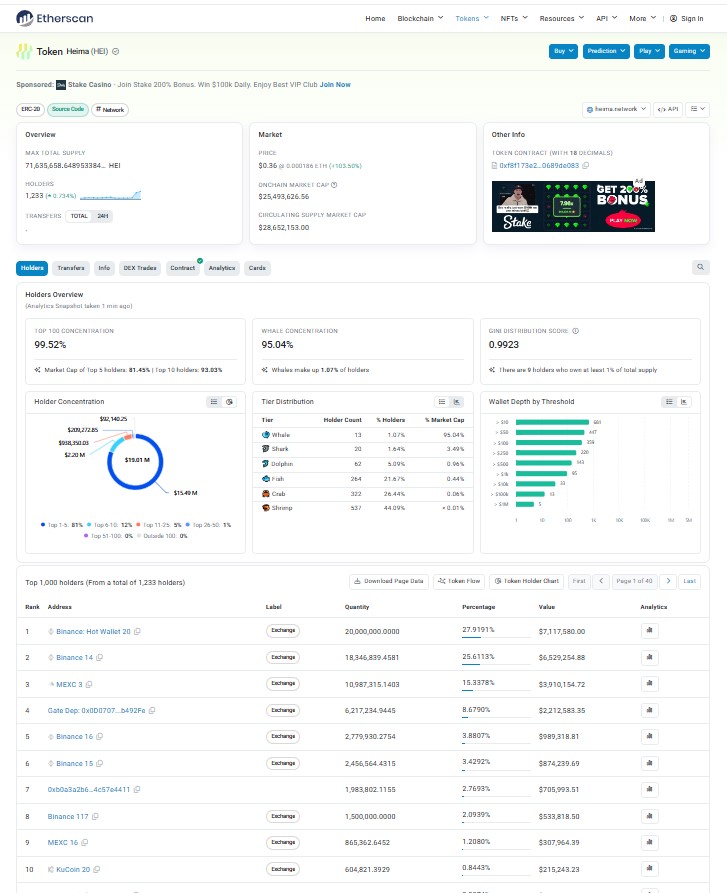
Top holders sit near 95% of the visible ERC-20 supply, but most of the largest wallets are labeled exchange addresses, such as Binance, MEXC, Gate, and KuCoin, rather than anonymous whale wallets.
That changes the risk picture a little. Custodial exchange balances aren't the same as one private wallet dumping on the market, though they can still move fast if sentiment turns. Full data sits on the Heima token holder page.
Heima in the Altcoin Market
HEI trades as a mid-tier infrastructure altcoin, and altcoins built around AI-adjacent identity and cross-chain tooling have had a stronger run lately than the broader market.
That narrative connects to the wider AI and crypto compute story playing out this year, where infrastructure tokens are catching bids ahead of majors.
Altcoin rallies this size usually give back a portion once leverage clears out. That doesn't mean the trend dies. It means the next few sessions matter more than the last one.
Tokenomics and Supply Risk
The circulating supply sits at 81.37M HEI against a 100M max, per CoinMarketCap, so there's not a massive unlock overhang left compared to many newer tokens.
FDV of $39.34M against a $32M market cap is a fairly tight gap, which is a healthier setup than tokens with FDV many multiples above their current cap.
Still, checking a token unlock calendar before trading around any date is worth doing, since schedules shift without much warning.
Scenarios by Timeframe
This is where a Heima price prediction gets split into probabilities instead of one single number.
Timeframe | Bull Case | Base Case | Bear Case |
24H | Holds above $0.39, tests $0.43 | Cools to $0.30-$0.35, RSI resets | Fails at $0.35, retests $0.24 |
7D | A weekly close above $0.40 confirms the breakout. | Range-bound $0.24-$0.40 | Weekly close under $0.24 |
30D | Volume holds; price tests $0.53 | Drifts back toward $0.20-$0.25 | Leverage unwind drags HEI under $0.14 |
2026 | Adoption and listings push toward $0.65-$1.00 | Stays range-bound as hype fades | Weak retention pushes HEI toward its 2025 low |
These are directional, not guarantees, and they lean on adoption trends that aren't confirmed yet.
Risks to Watch
Leverage-driven rallies unwind fast once funding rates flip, and that's the single biggest near-term risk here.
Broader macro conditions matter too. Watch how the Fed's rate decision shapes risk appetite across smaller-cap tokens like HEI over the coming weeks.
Regulatory headlines are another thread. The ongoing Clarity Act developments tend to move sentiment across the whole altcoin market, not just one token.
Historical Context
HEI peaked at $1.36 on February 13, 2025, and even after this rally, the price sits roughly 74% below that high, per CoinMarketCap.
It also printed a fresh all-time low of $0.01821 in October 2025 before climbing back to current levels, a gain of over 1,800% off that floor.
Both numbers are true at once. Which one matters more depends entirely on your entry point.
And that gap between the low and the high is exactly why a single Heima price prediction number rarely tells the full story.
Methodology
Levels came from daily and weekly TradingView charts for HEIUSDT on MEXC, using RSI-14 and EMA20. Supply and market data came from CoinMarketCap, liquidation data from CoinGlass, and holder concentration from Etherscan.
All figures were checked against the screenshots provided and are timestamped August 6, 2026, roughly 18:36 UTC.
Disclaimer: This is speculative market commentary, not investment advice. Crypto assets are volatile and can lose most or all of their value. Do your own research before trading.


















