Holoworld AI Price Prediction: Can HOLO Recover After Rejection?


A Sharp Rejection Tests the Recovery Structure
Holoworld AI is trading near $0.07051 after a sharp 13.1% drop over the past 24 hours, and this Holoworld AI price prediction centers on what that move means for the token's broader chart structure.
Price recently pushed through the top of a rising channel and briefly touched the $0.10234 area, only to reverse hard and fall back inside the ascending structure it had just escaped.
That failed breakout is the real story here, not the initial spike, and whether the channel absorbs this rejection or gives way to a deeper correction is the question this setup now has to answer.
Why Price Is at an Important Decision Point
Market cap sits near $53.79 million, down 13.03% in line with the price drop, while 24-hour volume actually climbed to about $31.26 million, a 70.57% increase that pushed the volume-to-market-cap ratio to 60.21%.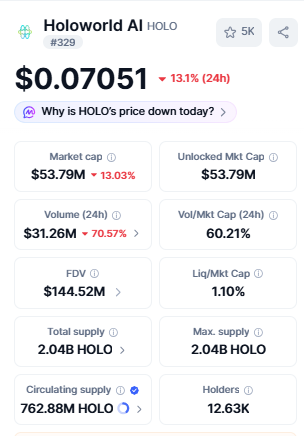
The fully diluted valuation stands near $144.52 million against a circulating supply of roughly 762.88 million tokens out of a 2.04 billion total and maximum supply, with holders near 12.63K.
Falling price alongside sharply rising volume points to heightened participation during the selloff, not a confirmed directional signal on its own.
That combination of a steep drop and a volume surge is exactly why the current chart structure needs a closer look rather than a quick conclusion.
Data source: CoinMarketCap
What Are Futures Traders Signalling?
Positioning data shows only a mild long-biased skew overall. The Binance account ratio sits at 1.0276, close to balanced, while top trader accounts lean somewhat more toward longs at 1.2599 and top trader positions at 1.3083.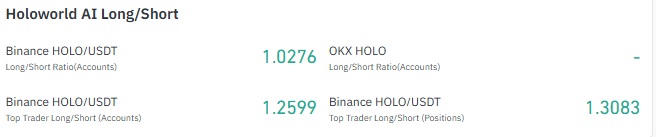
OKX data is currently unavailable. This is a modest tilt, not a market dominated by one side.
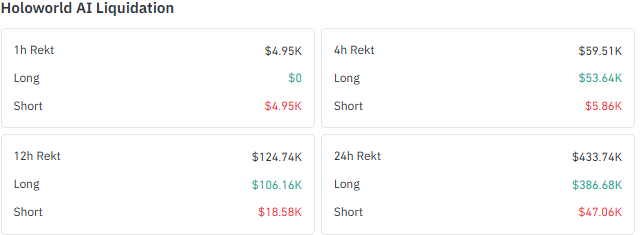
Liquidation data tells a sharper story. Of the $433.74K liquidated over the past 24 hours, $386.68K, close to 89%, came from long positions, consistent with the rejection catching leveraged bulls off guard.
The 12-hour and 4-hour windows show the same long-heavy pattern, though the most recent 1-hour window flipped to short liquidations only, a reminder that very short-term positioning can shift quickly even while the broader 24-hour picture stays long-dominated.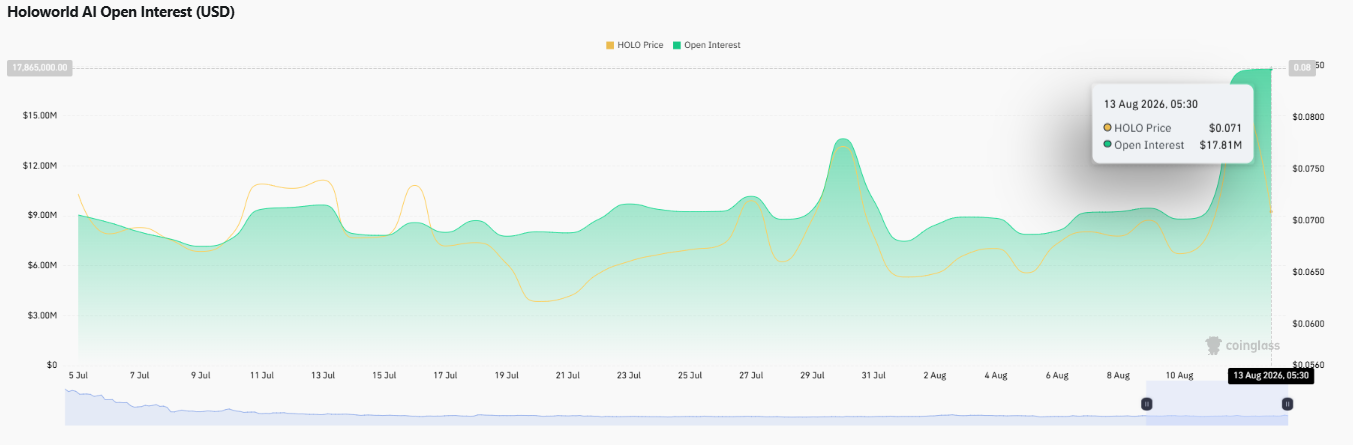
Open interest stands near $17.81 million, having risen sharply alongside the recent volatility spike.
Elevated participation after such a sharp rejection does not confirm direction by itself, but it does raise the importance of whatever technical confirmation comes next.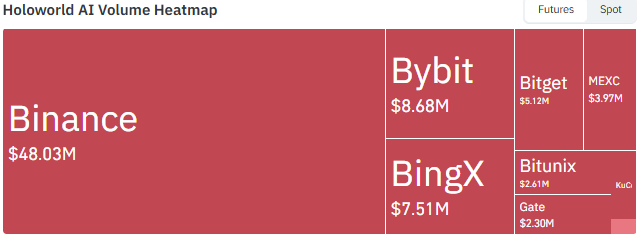
Futures activity is heavily concentrated on Binance near $48.03 million, with Bybit and BingX forming a distant second tier.
Data source: Coinglass
How Has Performance Looked Across Timeframes?
The token is roughly flat over four hours at +0.06% but down 14.30% over 24 hours.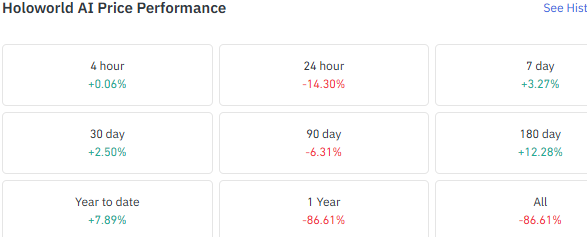
Zooming out tells a different story: it is up 3.27% over 7 days, 2.50% over 30 days, 12.28% over 180 days, and 7.89% year to date, even after the latest drop.
The 90-day change sits at -6.31%, and the 1-year figure remains deeply negative at -86.61%.
The sharp daily decline is significant, but it has not by itself erased the broader recovery pattern visible on the daily chart, even though the long-term trend is still far from an established uptrend.
Data source: Coinglass
Daily Chart: Failed Breakout, Channel Still Intact
The TradingView daily chart shows a rising channel that has been developing since early June 2026.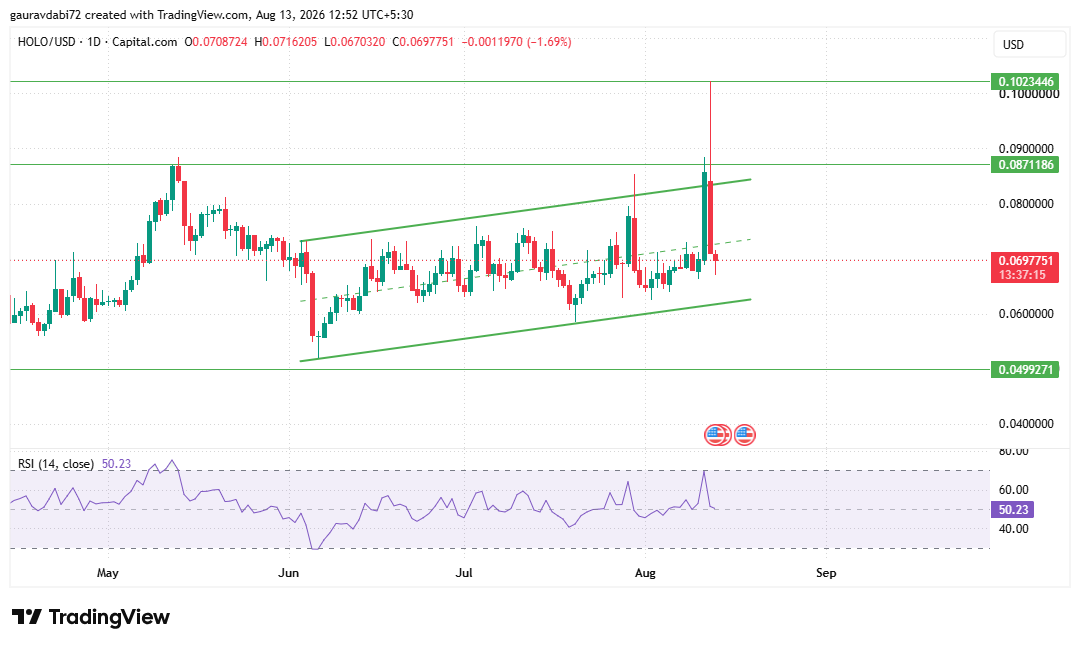
Price recently pushed aggressively through the upper boundary of that channel and briefly tested the major resistance near $0.10234, but buyers failed to hold that ground.
The long upper wick left behind reflects strong rejection at higher prices, and the move is best described as a failed upside breakout rather than a confirmed one.
Despite that rejection, the broader ascending channel itself has not broken down. Price has returned inside the structure it briefly escaped, which keeps the recovery pattern technically alive even as short-term momentum has clearly cooled.
Daily RSI reads 50.23, essentially back at the neutral midpoint after surging during the spike.
This shows momentum has cooled sharply and returned to a largely neutral reading. It is not oversold, and it is not showing strong bullish momentum either, sitting squarely in neutral territory.
A renewed push above 50.23 alongside price recovery would strengthen the case for a resumption higher, while a sustained slide below the midline paired with weakening channel structure would raise the odds of a deeper correction.
The first major resistance to watch on any recovery attempt is $0.08712. A sustained move back above that level would improve the technical picture and put the market within reach of challenging the recent rejection zone, with $0.10234 becoming relevant again only once $0.08712 is reclaimed and held.
On the downside, the channel's rising lower boundary is the key structural support to watch.
A decisive break below that boundary would weaken the broader recovery case materially, and only then would the deeper horizontal support at $0.04993 come into play.
Data source: TradingView
Holoworld AI Price Prediction: What Happens After the Rejection?
This HOLO price forecast now comes down to two conditional paths that stay open until the channel either holds or breaks.
Scenario | Key Levels |
Recovery Case | The ascending channel stays intact, and momentum rebuilds. A reclaim of $0.08712 would mark the first meaningful recovery signal, with $0.10234 becoming relevant only after that level is reclaimed and held. |
Failure Case | Price weakens toward the lower portion of the channel and the ascending structure eventually breaks. $0.04993 becomes the major deeper horizontal support only if that breakdown extends considerably. |
Neither path is guaranteed. The rejection was sharp, but the broader ascending structure has not yet been invalidated.
Can HOLO Keep Its Recovery Structure Intact?
As per the Coin Gabbar analyst, the tension in this setup is straightforward. A failed upside breakout has clearly damaged short-term momentum, yet the daily ascending channel that has defined this recovery since early June remains intact.
RSI sitting at a neutral 50.23, sharply increased trading activity, recently elevated open interest, and a 24-hour liquidation total dominated by longs all point to a market still working through the aftermath of that rejection rather than one that has settled on a direction.
The rejection has not yet invalidated the larger daily recovery structure. The next meaningful signal should come from either a genuine recovery toward $0.08712 or clear deterioration of the ascending channel itself, and until one of those plays out, the setup remains a wait-and-watch situation rather than a confirmed trend.
What We Are Watching Next
Whether price stabilizes inside the Daily ascending channel
Whether $0.08712 can be reclaimed
Daily RSI behavior around the 50 level
Whether elevated open interest persists after the volatility spike
Whether long liquidations continue dominating
Whether price starts testing the channel's rising lower boundary
Disclaimer: This article is for informational purposes only and should not be considered financial or investment advice. Cryptocurrency markets, including Holoworld AI (HOLO), are highly volatile, and all price levels discussed are conditional technical scenarios, not guarantees. Readers should conduct their own research and consult a qualified financial advisor before making any investment decisions.

















