Bitcoin Cash Price Prediction: Can BCH Flip the Fakeout?


Bitcoin Cash price prediction watchers just saw something worth paying attention to. BCH tried to break higher, got rejected almost instantly, and then turned right back around to reclaim the same zone within hours.
That kind of quick recovery after a fakeout tends to say more about underlying strength than a clean breakout would have.
This breakdown uses chart structure, CoinGlass data, and market context supplied for this piece.
It is meant purely for informational purposes and is not financial advice. CoinGabbar and the analyst preparing this article do not hold a position in BCH at the time of publication.
The levels discussed here come from the 4-hour BCH perpetual chart and represent a short-term view. If the price moves decisively outside these ranges, this Bitcoin Cash price prediction should be revisited rather than assumed to still apply.
Bitcoin Cash (BCH) Price Right Now
Metric | Value |
Current Price (CMP) | $214.9 |
24-Hour Change | +0.75% (+1.6003) |
Market Cap | $4.31B |
Futures Volume (24h) | $111.38M |
Spot Volume (24h) | $7.08M |
Open Interest | $317.12M |
Circulating Supply | 20.07M |
Total Supply | 20.07M |
Max Supply | 21.00M |
Open interest currently sits at $317.12M, which is the total value of BCH futures contracts still open across the market.
Relative to BCH's market cap, that is a meaningful amount of leveraged exposure, which helps explain why the failed breakout attempt triggered such a sharp reaction on the chart.
Chart source: TradingView, BCH/USDT Perpetual Contract, Bybit, 4-hour timeframe, captured 13 August 2026, around 2:01 PM IST (08:31 AM UTC). Data source: CoinGlass, Bitcoin Cash market page, captured 13 August 2026, around 2:01 PM IST.
Methodology and Data Sources
The structure behind this Bitcoin Cash price prediction comes from a direct reading of the 4-hour BCH perpetual chart on Bybit, tracking the descending trendline break, the fake breakout attempt, and the horizontal levels marked on it.
Market figures such as volume, open interest, and supply data are pulled from CoinGlass, and liquidation numbers come from CoinGlass's liquidation tracker for BCH.
BCH Liquidation Data Today
Liquidation flow on BCH has been light so far but still leans entirely toward shorts, which fits the price action following the failed breakdown.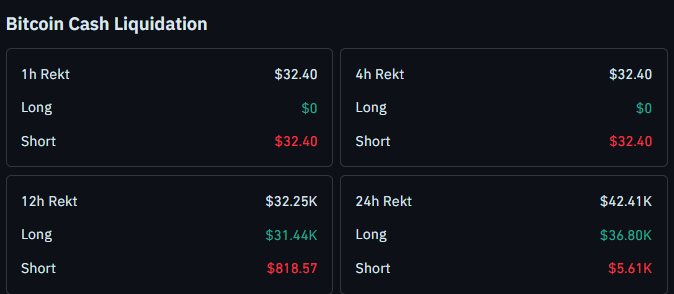
The last hour saw just $32.40 in total liquidations, all of it from short positions, with longs sitting untouched at $0.
The 4-hour window shows the exact same figure, $32.40, again entirely from shorts.
Zooming out to 12 hours, rekt totals climb sharply to $32.25K, with $31.44K coming from longs against just $818.57 from shorts, a clear reversal from the shorter windows.
Across the full 24 hours, total liquidations reached $42.41K, made up of $36.80K in longs and $5.61K in shorts.
The heavier long liquidations across the 12h and 24h windows point to traders getting caught out during the fake breakout rejection, while the very short-term windows show shorts now starting to get squeezed as price recovers.
Source: CoinGlass, BCH liquidation data, captured 13 August 2026.
Bitcoin Cash Trend and Momentum: Key Takeaways
BCH is trading at 214.9, holding above a zone it briefly lost after a failed breakout attempt
Price attempted to break the descending trendline earlier, got rejected instantly, then recovered off the 212.4 support zone
A close above 216.6 opens the door to 221.8, then 226.8, with 242.2 as an extended target
A close below 212.4 would flip the near-term picture bearish, pointing toward 210.4 and then 208.4
Long liquidations dominated the 12h and 24h windows, consistent with the fake breakout catching buyers off guard
Short liquidations are now leading in the 1h and 4h windows as price recovers off support
Leveraged positions around any of these zones carry real liquidation risk, as the numbers above show.
These levels describe a chart-based framework, not a guarantee of what comes next.
Bitcoin Cash Price Prediction: 4-Hour Chart Analysis
BCH tried to break its descending trendline structure recently, and for a moment it looked like the move was going to fail entirely.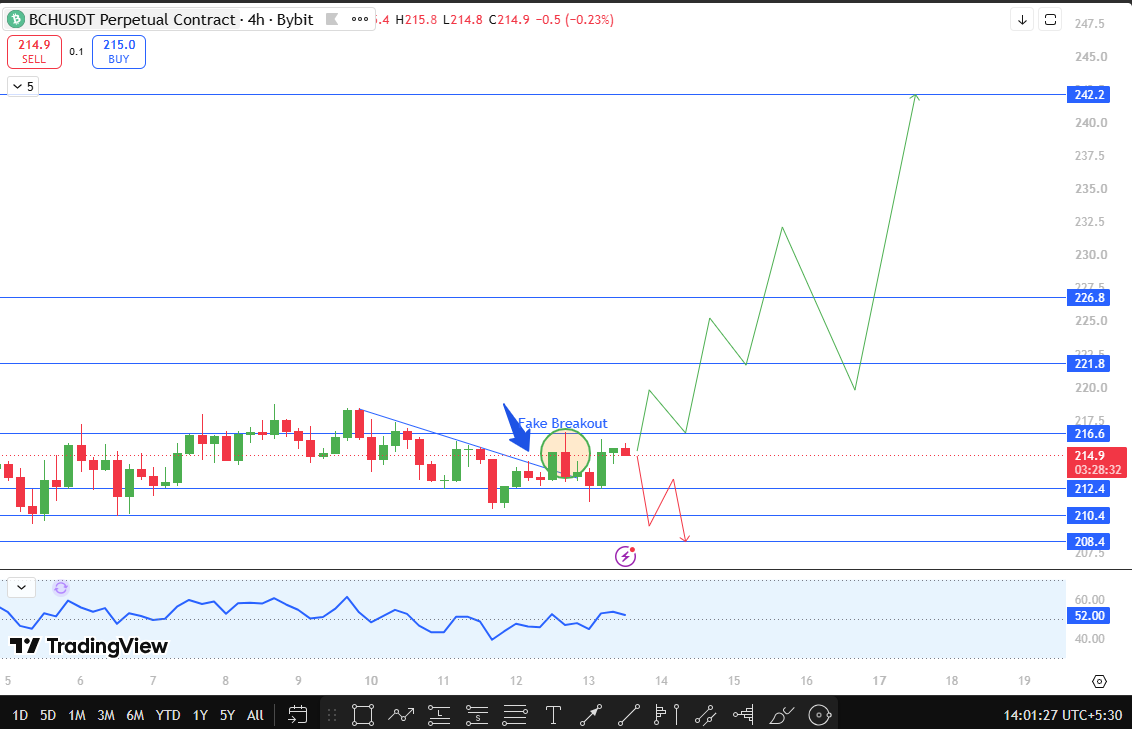
Price pushed above the trendline, got rejected almost immediately, and dropped back down toward the 212.4 zone.
That kind of sharp reversal right after a breakout attempt is usually a red flag for bulls.
What changed the picture for this Bitcoin? Cash technical analysis is what happened next.
Instead of continuing lower, buyers stepped in hard right at 212.4, and the price snapped back up just as quickly as it had fallen.
That instant defense of support is often a stronger signal than the original breakout attempt itself, since it shows real demand sitting underneath the market rather than just momentum chasing.
BCH is now trading back above the zone it briefly lost, and the setup from here is fairly straightforward.
A 4-hour close above 216.6, just 0.79% above CMP, would confirm the reclaim is holding and the fake breakout is now behind it.
From there, 221.8 becomes the next resistance, about 3.21% higher, followed by 226.8 near 5.54% above CMP.
If momentum builds from there, this Bitcoin Cash price forecast stretches further toward 242.2, roughly 12.7% above CMP, though that level sits well beyond the immediate structure and would need strong follow-through to actually get tested.
On the downside, 212.4 remains the level that matters most, since it is the same zone that already proved its strength once.
A 4-hour close below it, about 1.16% under CMP, would suggest the recovery has failed.
Below that, 210.4 becomes the next support near 2.09% lower, and a further slip toward 208.4, close to 3.02% under CMP, would be the deeper test of whether buyers can defend this zone a second time.
Bitcoin Cash Technical Outlook Snapshot
Indicator | Signal |
Price Structure | Fake breakout rejected, instant recovery off 212.4 support |
Momentum Oscillator | Reading near 52.00, no clear directional tag currently |
Immediate Bias | Cautiously bullish above 212.4 |
Bullish Trigger | 4H close above 216.6 |
Bearish Trigger | 4H close below 212.4 |
Invalidation | 4H close below 208.4 |
Bitcoin Cash Support and Resistance Levels to Watch
Type | Level | Note | % From CMP |
Resistance | $242.2 | Extended target, needs strong follow-through | +12.7% |
Resistance | $226.8 | Short-term resistance | +5.54% |
Resistance | $221.8 | First breakout target | +3.21% |
Resistance | $216.6 | Immediate resistance, breakout trigger | +0.79% |
Current Price | $214.9 | Live CMP | 0% |
Support | $212.4 | Reclaimed support, already defended once | -1.16% |
Support | $210.4 | Next support on breakdown | -2.09% |
Support | $208.4 | Deeper invalidation level | -3.02% |
BCH Risk-Reward Table
Case | Trigger | Target |
Bullish continuation | 4H close above 216.6 | 221.8, then 226.8 |
Extended bullish | Strong follow-through volume | 242.2 |
Bearish breakdown | 4H close below 212.4 | 210.4 |
Deeper breakdown | 4H close below 210.4 | 208.4 |
Invalidation Level
This Bitcoin Cash price prediction treats a 4-hour close below 208.4 as invalidation for the current bullish structure.
Below that level, the case for BCH holding its recovery weakens considerably, and the setup would need a full reassessment.
Trading around any of these zones on leverage carries genuine risk. A false recovery above 212.4 followed by another rejection is possible before the breakout truly confirms, and the liquidation data above already shows how quickly overleveraged positions got caught out during the initial fake breakout.
How Bitcoin Could Influence Bitcoin Cash
Bitcoin sentiment remains relevant for this BCH crypto forecast, even though BCH is itself a Bitcoin fork with its own independent structure.
A stable or rising Bitcoin would likely support BCH holding above 212.4 and building toward 216.6 and 221.8.
A risk-off-shift in Bitcoin, on the other hand, would make a second breakdown below 212.4 more likely even after this recovery.
Glossary
Fake Breakout: A price move that briefly breaks a key level before quickly reversing, often trapping traders positioned for continuation.
Open Interest: The total value of outstanding futures or perpetual contracts that remain open and unsettled.
Liquidation: The forced closing of a leveraged position by an exchange once losses erode a trader's required margin.
Support Zone: A price area where buying pressure has historically been strong enough to stop or reverse a decline.
Invalidation Level: The price point at which a technical outlook is no longer considered valid, requiring the setup to be reassessed.
CoinGabbar's Technical Analyst View
Bull Case: BCH closes a 4-hour candle above 216.6, confirming the fake breakout is fully behind it, and momentum carries price toward 221.8, 226.8, and potentially 242. 2.
Base Case: BCH holds above 212.4 but struggles to clear 216.6 decisively, leading to a choppy stretch between the two levels as the market digests the recent fake breakout.
Bear Case: BCH closes below 212.4, undoing the recovery, and slides toward 210.4, with a further close below that level opening the door to 208. 4.
Disclaimer
This Bitcoin Cash price prediction is prepared for informational purposes only and should not be treated as financial or investment advice. Cryptocurrency markets, including $BCH, are highly volatile, and leveraged trading carries significant risk of loss, including liquidation, as shown in the data above. Readers should conduct their own research and consult a qualified financial advisor before making any investment decisions. CoinGabbar and the analyst preparing this piece do not hold a position at the time of publication.
Also read:

















