Hyperliquid Price Prediction: Trendline Retest Eyes 18% Upside


Hyperliquid has been one of the more closely watched perpetual DEX tokens this year, and the next few hours could decide whether the current setup turns into a fresh leg higher or a sharper pullback.
Traders running the Hyperliquid price prediction models are watching one specific line on the chart right now, and the reaction around it is drawing attention across the derivatives market.
This is not financial advice, and the levels discussed below are drawn from a 1-hour HYPE/USDT perpetual chart on Binance, so they reflect a short-term, intraday to multi-day view rather than a long-term forecast.
HYPE Market Snapshot Today
Hyperliquid (HYPE) is trading at $58.419, down 1.35% on the day.
Futures volume over the past 24 hours stands at $1.76B, while spot volume is a much smaller $83.03M, showing that most current activity is happening through leveraged futures positions rather than spot buying.
Open interest, which is the total value of all open futures and perpetual contracts that have not yet been settled, sits at $2.44B.
Market cap is $14.74B against a circulating supply of 252.51M , with total and max supply both at 952.57M, meaning the full token supply is already in circulation.
Source: CoinGlass, August 19, 2026.
Methodology and Data Sources for This HYPE Price Prediction
This HYPE price prediction is built from a 1-hour HYPE/USDT perpetual chart on Binance, viewed through TradingView.
The ascending trendline and the higher-high retest referenced below are marked directly on that chart.
Price, volume, open interest, and liquidation figures are sourced separately from CoinGlass and are cited individually below with their own timestamps.
The forecast horizon here is short-term, generally the next few hours to a few trading days, and should be rechecked if the price closes meaningfully beyond the range discussed.
Hyperliquid Whale Flow: Multicoin Moves HYPE to Coinbase
A fresh on-chain alert adds some near-term caution to this HYPE price outlook.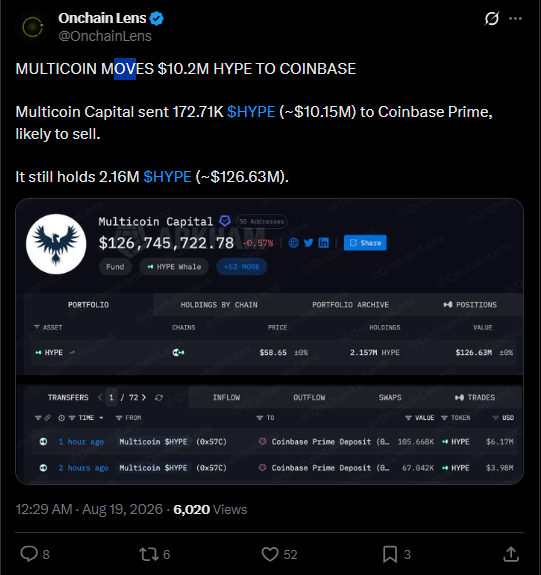
Multicoin Capital sent 172.71K HYPE, worth roughly $10.15M, to Coinbase Prime, a move typically associated with an intent to sell rather than long-term holding.
The fund still holds 2.16M HYPE worth about $126.63M, so this transfer represents a small slice of its total position rather than a full exit.
Even so, exchange inflows from large holders can add short-term selling pressure and are worth watching alongside the technical picture.
Source: OnchainLens on X, August 19, 2026, 12:29 AM IST.
Hyperliquid Liquidation Data Today
Liquidation activity shows a mixed but informative picture.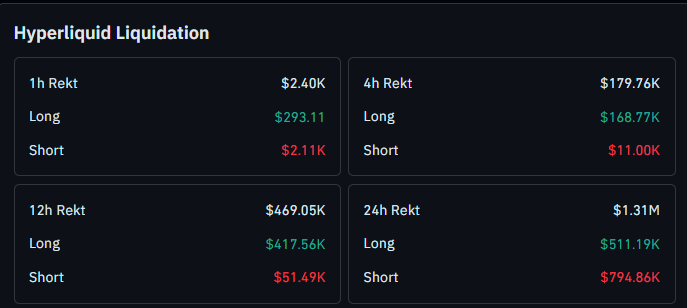
Over the past hour, total liquidations were light at $2.40K, with $293.11 in long-side liquidations against $2.11K in short-side liquidations.
Over four hours, long-side liquidations jumped sharply to $168.77K out of $179.76K total, suggesting the recent pullback toward the trendline squeezed leveraged long positions.
Over 12 hours, long-side liquidations remained dominant at $417.56K against $51.49K in short-side liquidations.
Zooming out to 24 hours, the picture flips: short-side liquidations led at $794.86K against $511.19K in long-side liquidations, out of a total $1.31M.
This tells a two-part story: shorts got squeezed earlier in the day as $HYPE pushed higher, while the recent hours have leaned on longs as price cooled back toward the trendline.
Source: CoinGlass, Hyperliquid liquidation data August 19, 2026.
HYPE Price Prediction: 1-Hour Chart Analysis
Price is currently trading near an ascending trendline on the 1-hour chart, and whether it holds or breaks here will likely decide the next directional move over the coming sessions.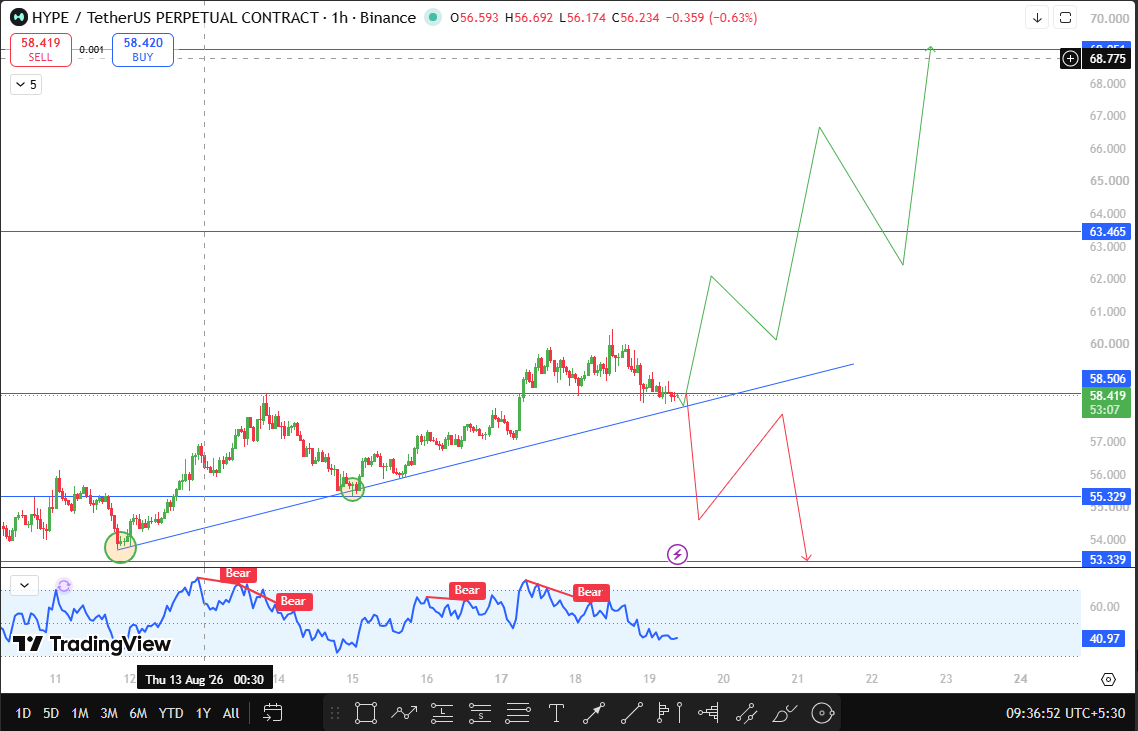
On the 1-hour HYPE/USDT perpetual chart, price has been respecting an ascending trendline since mid-August.
The first retest of this trendline produced a new higher high, which is a meaningful signal because it shows buyers stepped in at the line rather than letting it fail, reinforcing the trendline's strength.
Price is now trading back near that same trendline for a second test.
The chart's built-in momentum indicator is currently reading near 40.97, and it has printed a series of bearish divergence tags at each swing high since mid-August, meaning momentum has been weakening even as price posted higher highs.
That kind of divergence does not guarantee a breakdown, but it does add some caution to the bullish case at this exact juncture.
If price sustains above 58.506 on this retest, the setup favors a breakout, with 63.465 as the first resistance and 69.051 as the next target on a stronger move.
On the other hand, a break of the trendline that sustains below 58.506 and then closes below 56.329 would confirm a structure shift to the downside, opening the door toward 53.339 as the next support.
HYPE Technical Outlook Snapshot
Indicator | Signal |
Trend structure | Ascending trendline, confirmed by higher high on first retest |
Current position | Retesting trendline near 58.506 |
Momentum reading | Near 40.97, bearish divergence tags at recent swing highs |
Bias above 58.506 | Bullish continuation toward 63.465 and 69.051 |
Bias below 56.329 close | Bearish structure shift toward 53.339 |
HYPE Support and Resistance Levels to Watch
Type | Level | Note | % From CMP |
Resistance 2 | 69.051 | Extended breakout target | +18.20% |
Resistance 1 | 63.465 | First resistance on breakout | +8.64% |
Trendline / Pivot | 58.506 | Must hold for bullish case | +0.15% |
Breakdown Confirmation | 56.329 | Close below confirms structure shift. | -3.58% |
Support 1 | 53.339 | Next support on confirmed breakdown | -8.70% |
HYPE Risk-Reward Table
Case | Trigger | Target |
Bull Case | Sustained close above 58.506 | 63.465, then 69.051 |
Bear Case | Trendline break, close below 56.329 | 53.339 |
Invalidation Level: The bullish structure is invalidated on a confirmed close below 56.329, which would shift the near-term bias to bearish and put 53.339 in focus.
What Would Change This HYPE Price Prediction?
A sustained close above 58.506 followed by a push through 63.465 would strengthen the bullish case and put 69.051 back on the table. Conversely, repeated rejection at the trendline combined with rising short-term long-side liquidations, similar to the pattern seen over the past four hours, would add weight to a bearish resolution.
How Bitcoin Sentiment Could Move HYPE
Coin trades as a high-beta asset relative to broader crypto market sentiment, and Bitcoin's direction often sets the tone for altcoin risk appetite.
A stable or strengthening Bitcoin tends to support continuation setups like the current HYPE trendline retest, while renewed Bitcoin weakness or a broader risk-off shift could accelerate a breakdown scenario even before HYPE's own levels are tested.
When This HYPE Price Prediction Gets Revisited
This setup will be revisited if Price closes decisively above 63.465 or below 56.329 within the next 24 hours, since either close would confirm the next directional phase.
Absent a confirmed close in either direction, the trendline retest remains the level to watch.
Glossary
CMP: Current Market Price, the live trading price at the time of writing.
Open Interest: The total value of all outstanding futures or perpetual contracts that have not been closed or settled.
Liquidation: The forced closing of a leveraged position when losses erode the trader's margin below the required maintenance level.
Perpetual Futures: A derivatives contract with no expiry date, allowing traders to hold leveraged long or short exposure indefinitely.
Ascending Trendline: A rising line connecting a series of higher lows, used to identify an uptrend and potential support.
Momentum Indicator: An oscillator that measures the speed and strength of recent price moves, often used to spot divergence from price action.
Bull, Base, and Bear Case for HYPE
Bull Case: Price holds the 58.506 trendline zone, confirms with a close above it, and extends toward 63.465 and eventually 69.051 as buyers reassert control.
Base Case: Price continues to chop around the 58.506 trendline zone without a decisive close in either direction, keeping the broader range intact until fresh volume or a catalyst forces a break.
Bear Case: Price fails to hold the trendline, closes below 56.329, and confirms a structure shift to the downside, opening a path toward 53.339.
Disclaimer
This article is for informational purposes only and does not constitute financial advice. Cryptocurrency markets, including perpetual futures, are highly volatile, and leveraged trading carries significant risk of loss. CoinGabbar and the analyst do not hold a position at the time of publication. Readers should conduct their own research before making any investment decisions.
Also read:







.webp)








