XPIN Network Price Prediction: $XPIN Crashes 25%, Reversal Incoming?


XPIN Network is one of the sharpest movers in crypto today, and traders who stepped away for even an hour are waking up to a very different chart.
This XPIN Network Price Prediction looks at whether the recent slide is a buying window before the next leg or a warning sign to stay cautious.
With sentiment swinging fast, the next few days could decide which crowd was right.
Market data was checked on August 19, 2026, at 09:42 IST.
XPIN Network Price Prediction Today: Price Analysis
Metric | Value |
Price | $0.0011004 |
24h Change | -25% |
Market Cap | $44.63M |
FDV | $109.307M |
24h Volume | $8.957M |
Circulating Supply | 40.83B XPIN |
Total Supply | 100B XPIN |
Max Supply | 100B XPIN |
Source: Data from CoinGecko as of August 19, 2026, at 09:42 IST. Figures may vary slightly across other tracking websites.
What is XPIN?
The token has been building a name for itself as a decentralized wireless project promising internet access without traditional telecom middlemen, and that story has pulled in a wave of retail attention over the past few months.
XPIN Network Liquidation and Volume Data
Timeframe | Total | Long | Short |
1h | $3.91K | $3.79K | $113.49 |
4h | $126.38K | $122.58K | $3.81K |
12h | $129.40K | $125.47K | $3.93K |
24h | $217.54K | $207.33K | $10.21K |
Long positions have been almost entirely responsible for XPIN's liquidations over the past day, per Coinglass futures data. 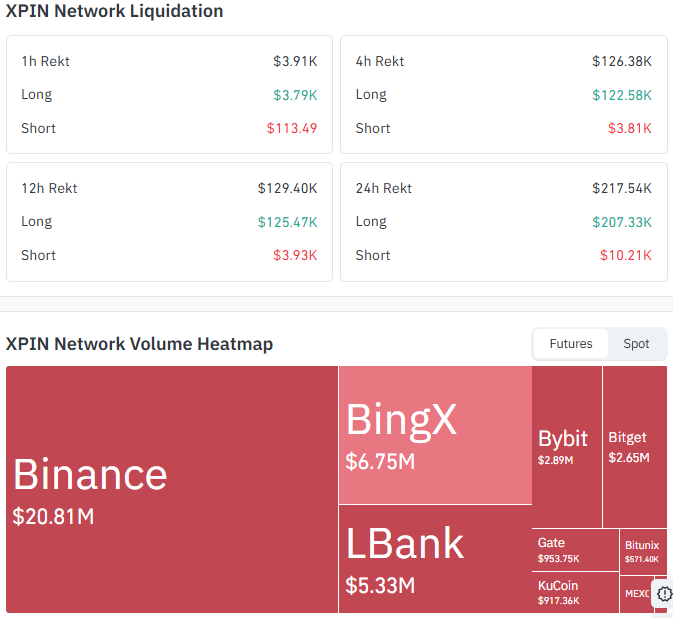
Source: Data From CoinGlass
Longs account for $207.33K of the $217.54K wiped out in 24 hours, while shorts lost just $10.21K, a pattern consistent across every shorter window too.
This is futures-specific data and separate from the spot volume in the table above.
Futures Volume by Exchange
Exchange | 24h Volume |
Binance | $20.81M |
BingX | $6.75M |
Binance dominates futures activity with roughly $20.81M in 24h volume, more than triple the next-largest venue.
That concentration means moves on Binance are likely driving much of XPIN's broader price action right now.
XPIN Network Price Prediction Chart: Technical Analysis
Pair: XPIN/USDT · Market: Spot (Crypto) · Timeframe: 1D · Source: TradingView · Timestamp: August 19, 2026, 09:42 UTC+5:30
XPIN is trading at $0.0011004, after breaking below the ascending trendline that had supported the price since the previous lows.
The break was sharp, with the previous daily candle closing well under the trendline and the nearest support level.
The EMA (Exponential Moving Average, a momentum indicator that weights recent candles more heavily) cluster sits well above the current price, with the 20-period EMA at $0.0015321 and the 50-period EMA at $0.0015161, both now acting as distant resistance rather than support.
XPIN's daily RSI sits at 26.63, deep in oversold territory, confirming a fast, momentum-driven sell-off rather than a slow bleed.
It's not a buy signal on its own; any bounce would need to hold above $0.0010013 to matter.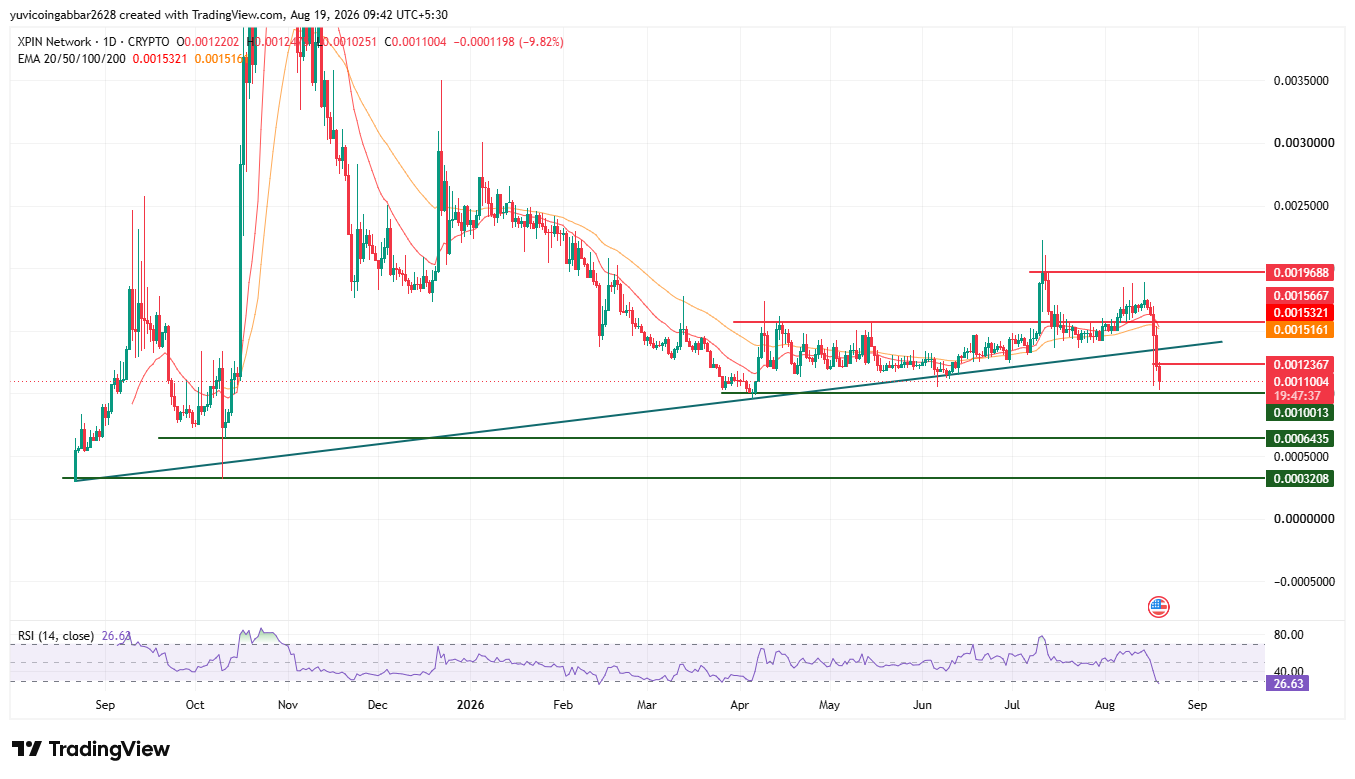
XPIN Network Key Price Levels to Watch
Level Type | Price |
Resistance 3 | $0.0019688 |
Resistance 2 | $0.0015667 |
Resistance 1 (nearest) | $0.0012367 |
Immediate Price Reference | $0.0011004 |
First Support | $0.0010013 |
Deeper Support | $0.0006435 |
Structural Floor | $0.0003208 |
EMA Levels
EMA | Price |
EMA 20 | $0.0015321 |
EMA 50 | $0.0015161 |
$XPIN Network Forecast: Bull Case vs Bear Case
$XPIN price target 2026 Bull case: Holding above $0.0010013 would keep the drop contained to a sharp pullback rather than a structural breakdown.
A recovery back above $0.0012367 would put the broken trendline zone back in play and open a path toward the EMA cluster near $0.0015161 to $0.0015321.
$XPIN price target 2026 Bear case: A close below $0.0010013 would confirm the trendline breakdown is structural, exposing $0.0006435 next.
Losing that level would put the $0.0003208 structural floor in view.
$XPIN Price Scenarios: Triggers and Invalidation
Scenario | Trigger | Likely Outcome | Invalidation Point |
Trendline reclaim / bullish | Close back above $0.0012367 | Move toward EMA cluster near $0.0015161–$0.0015321 | Next level: $0.0015667 & $0.0019688 |
Range hold | Price stabilizes between $0.0010013 and $0.0012367 | Sideways consolidation before the next move | Break of either boundary |
Breakdown / bearish | Close below $0.0010013 | Slide toward $0.0006435 | Reclaim of $0.0010013 |
Can $XPIN Reach $0.0019688?
$0.0019688 is the highest resistance level marked on the chart.
Getting there would require $XPIN to first reclaim the broken trendline zone above $0.0012367, then clear the EMA cluster at $0.0015161 to $0.0015321, before pushing through $0.0015667, a multi-stage recovery, not a single move from current levels.
What Could Invalidate the Bullish Setup?
A failure to hold $0.0010013 followed by a daily close below it would confirm the trendline breakdown is structural rather than a shakeout.
A further slide through $0.0006435 would put the $0.0003208 structural floor at risk.
XPIN Network Price Prediction: Expert View
According to CoinGabbar analysts, The trendline break combined with an RSI reading of 26.63 points to a market that sold off hard and fast, and the liquidation data backs that up: longs absorbed nearly all the damage across every timeframe.
Binance's outsized share of futures volume suggests this move is being driven by concentrated activity on one venue rather than broad-based selling.
The $0.0010013 level is the line in the sand here holding it keeps the pullback contained, while losing it opens a longer path down toward $0.0006435.
Disclaimer: This piece is for informational purposes only and isn't financial advice. The levels and scenarios above are based on technical chart analysis and publicly available data at the time of writing, and crypto markets can move sharply within hours, so past patterns don't guarantee future outcomes. It's worth doing independent research and considering your own risk tolerance before acting on any of the levels discussed here.
Also read:







.webp)








