Bitway Price Projection: Can BTW Hold the Binance-Driven Rally?


A small utility token most traders had never heard of a month ago just ripped 67% in a day, and nobody outside the chart is talking about it yet.
Whales, Whitepapers and a 67% Candle Nobody Saw Coming
Bitway price projection conversations are suddenly everywhere, and there's a reason for that. This coin didn't creep up. It jumped.
Somewhere between a staking campaign, a router-proxy exchange wallet buying in, and a chart pattern traders call a "breakout," BTW turned into one of the loudest tickers on the board this week.
We're not here to hype it. We're here to walk through what actually moved, why it moved, and where it could go from here.
There's a $200K reward pool tied to this token that started today. There's a whale wallet holding more than seventy percent of the supply. And there's an RSI reading that's flashing a warning most new buyers won't notice until it's too late.
So where does that leave the Bitway price projection for the next week, the next month, and beyond? Let's get into it.
Bitway Price Projection: Key Takeaways
-
BTW traded near $0.596 as of 09:40 UTC, up roughly 67% on the day and 48% on the week.
-
The rally followed an ascending channel breakout on the 4-hour trading chart, with RSI 14 at 86.90, deep in overbought territory.
-
A newly announced Binance Wallet Earn Booster Season 5, worth $200,000 in BTW rewards, launched August 19, 2026, and lines up almost exactly with the price move.
-
Whale concentration sits at 99.74%, and one wallet alone holds over 72% of circulating supply, a real risk for anyone chasing this candle.
-
Base case for 30 days points toward $0.025 to $0.045, the bullish forecast is invalidated by a daily close below $0.274.
Why Is Bitway BTW Price Moving Today
Here's the thing: this wasn't a random pump. Three things lined up at once.
First, Bitway announced that its Binance Wallet Earn Booster Season 5 went live, offering $200,000 in $BTW rewards to holders who keep their $U stake active through October 2, 2026.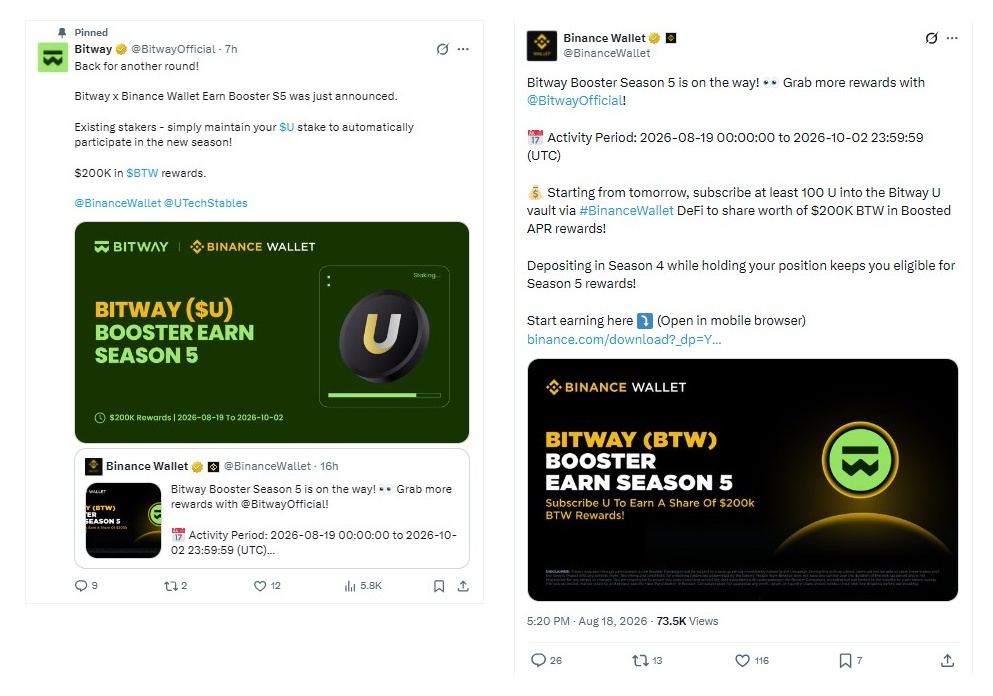
Second, Binance Wallet confirmed the same activity period and told users a new deposit window opens the next day, which pulled fresh capital toward the token almost overnight.
Third, short sellers got caught leaning the wrong way. 24-hour liquidation data shows $2.09M wiped out, with $1.72M of that coming from short positions alone. That's a squeeze, not organic demand alone, according to CoinGlass.
Trading volume backed it up too. 24-hour volume hit $93.1M, up over 141% from the prior session, according to CoinMarketCap.
Where Is Bitway Price Right Now
As of 09:40 UTC on August 19, 2026, BTW traded around $0.5942 to $0.6004 across major venues, up 67.5% on CoinMarketCap and 61.70% on-chain per BscScan.
Market cap sits near $1.6B against a fully diluted valuation of $5.88B, which tells you circulating supply is still a small slice of the total ten billion token cap.
The 24-hour high was $0.608650, and the low was $0.3496. That's a wide range for one day. The liquidity-to-market-cap ratio reads just 0.14%, which is thin.
Thin liquidity plus a huge daily range equals volatility. Expect more of it.
Bitway Technical Chart Analysis: 4-Hour and Weekly
4-Hour Chart Analysis
On the 4-hour trading view, BTW broke out of an ascending channel that had been building since early August, with trading pushing from open $0.569 to a high of $0.608650 before settling near $0.595950, a session gain of 4.66%.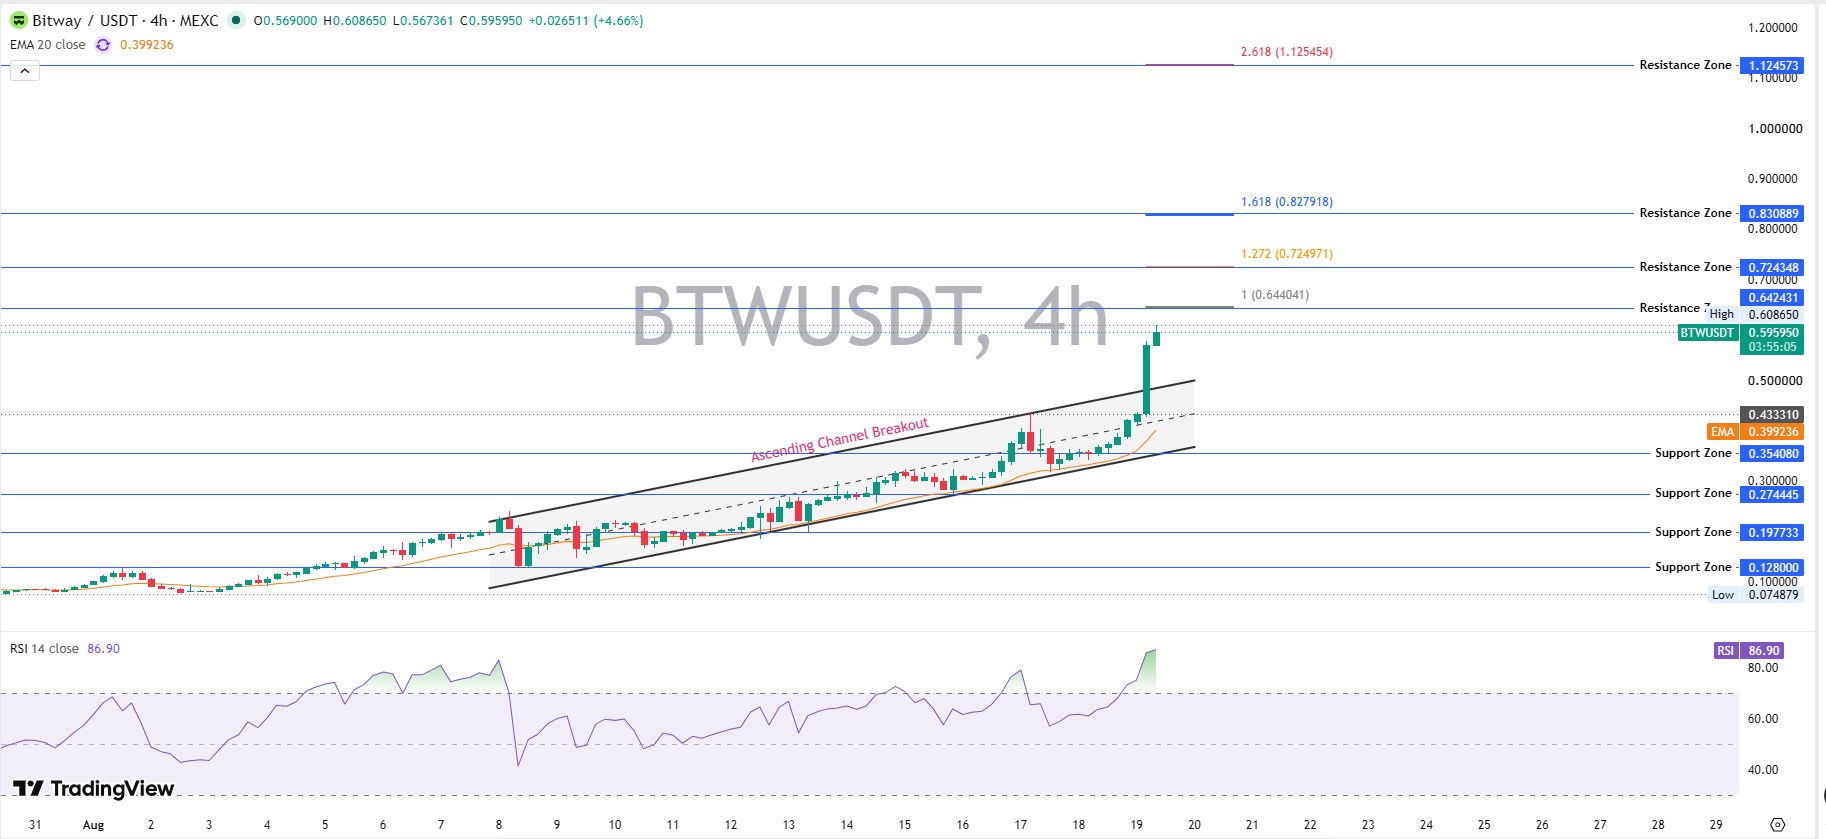
RSI 14, a momentum indicator that measures how fast and how far price has moved, read 86.90 on this timeframe. Anything above 70 usually signals overbought conditions. This is well past that.
EMA 20 (a 20-period moving average that smooths out short-term noise) sits at just $0.399236, far below current trading levels, which shows how stretched this move already is.
Fibonacci extension levels place resistance zones at $0.642, $0.724, $0.831, and $1.125, while support sits stacked at $0.354, $0.274, $0.198, and $0.128. Short-term traders should watch $0.354 closely. And a break below the channel's lower boundary would end this breakout structure fast.
Weekly Chart Analysis
Zoom out to the weekly trading chart, and the picture gets more dramatic. The current weekly candle opened at $0.397463, ran as high as $0.608650, and trades near $0.590301, up 48.49% for the week.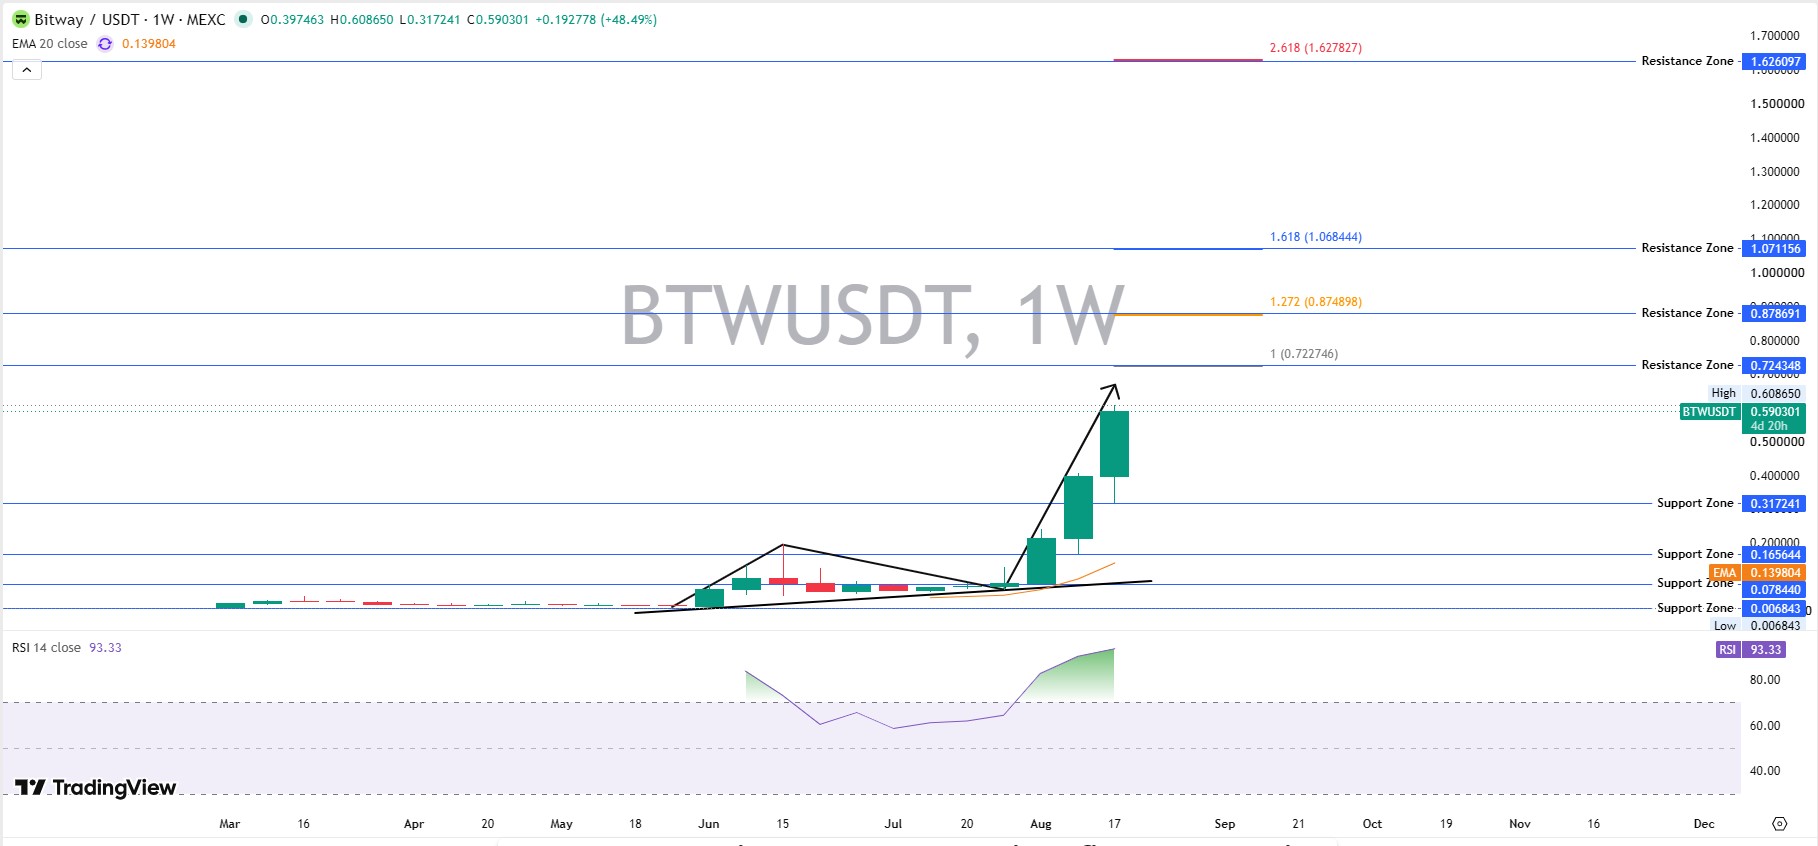
RSI 14 on the weekly timeframe reads 93.33. That's not just overbought; that's one of the more extreme readings a trading chart can show. EMA 20 sits at $0.139804, meaning trading is running more than four times above its own weekly trend average.
Weekly resistance zones, based on Fibonacci extensions, sit at $0.724, $0.879, $1.071, and $1.626. Weekly support drops to $0.317, then $0.166, then $0.078 near the base of this year's structure.
None of this guarantees continuation. Overbought can stay overbought. But it also means pullbacks, when they come, tend to get sharper. Traders can review the live setup on TradingView.
Bitway Support and Resistance Levels That Matter
Support on the 4-hour chart sits at $0.354, then $0.274, then $0.198, then $0.128.
Weekly support zones sit lower, at $0.317, $0.166, and $0.078.
A close below $0.020 on the daily chart would break the current bullish structure completely, and that's the line most short-term traders should watch. For a deeper breakdown of the current whale-driven rally structure, this recent rally whale wallet analysis covers similar ground from a slightly earlier snapshot.
Bitway Tokenomics and Token Unlock Schedule
As per Bitway tokenomics , the total supply is fixed at 10,000,000,000 BTW. The circulating supply at TGE (Token Generation Event, the moment a token first becomes tradable) started at just 22%, or 2.2 billion tokens.
A full unlock stretches out roughly four years. The community holds the largest slice at 26.67%, followed by the ecosystem and team at 20% each, backers at 16.33%, partners at 12%, and liquidity at 5%.
Team tokens carry a 12-month lockup before 36 months of linear vesting. Backers face a similar 12-month lockup with 24 months of vesting. Partners and liquidity allocations were fully unlocked at TGE with no lockup at all.
That vesting schedule matters. As more community and ecosystem tokens unlock monthly, sell pressure builds over time regardless of what price does today. Readers following the unlock story from earlier moves might also check this breakout chart pattern writeup for context on how prior unlocks played out.
Whale Wallets and Holder Concentration
This is the part most coverage skips, and it matters more than the candle.
BscScan data puts whale concentration at 99.74%, with just 33 wallets classified as whales. Top 100 wallets alone control 99.87% of supply. The Gini score reads 0.9999, about as concentrated as a token distribution gets.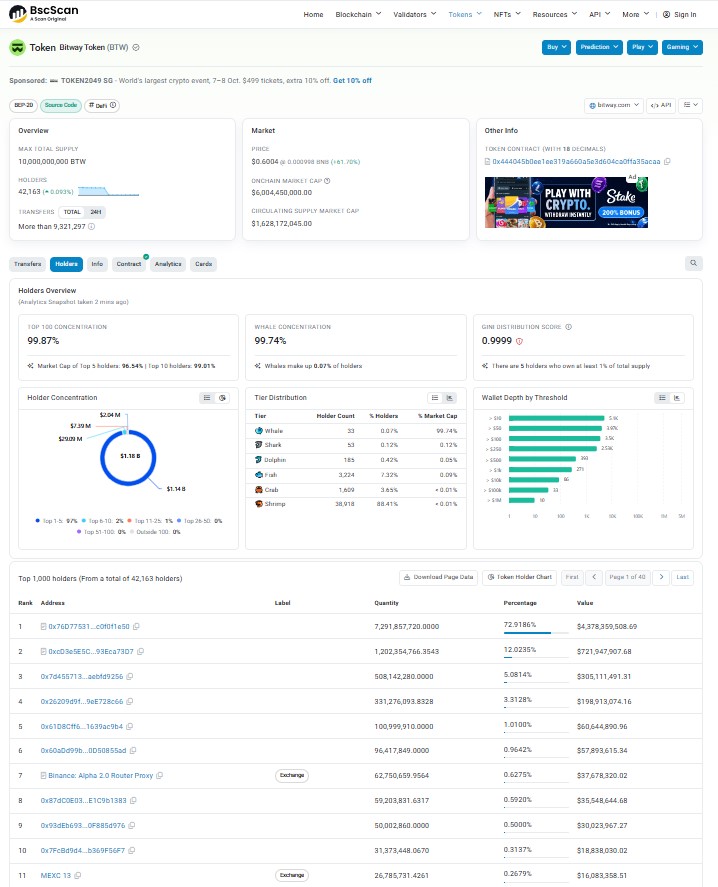
The single largest wallet holds 72.9% of supply, worth roughly $4.38B at current trading levels. That address isn't tagged as an exchange, so it likely represents a locked contract, treasury, or liquidity wallet rather than a free-floating whale, though that can't be confirmed without official disclosure.
Two wallets are tagged directly: a Binance Alpha 2.0 Router Proxy and an MEXC deposit wallet, both exchange-related and both holding under 1% each.
Shrimp wallets (holders under $1,000) make up 88.41% of all addresses but control less than 0.01% of market cap. That's a textbook top-heavy distribution. For traders tracking similar squeeze setups, this short squeeze pattern breakdown walks through comparable wallet behavior from a prior rally.
Bitway as an Altcoin: Where It Fits in the Broader Market
Bitway isn't a memecoin. It's a utility and governance altcoin tied to a real product stack, staking, payments, and a proof-of-stake chain called Bitway Ledger.
$BTW secures that chain, pays gas fees on it, and gives holders staking-based access to boosted rewards and fee discounts across Bitway's products.
That utility angle is part of why the Binance Wallet booster campaign carries weight. It's not a random giveaway. It's tied to actual staking mechanics on an actual settlement layer. Broader altcoin momentum context is available on price prediction hub, which tracks similar setups across the sector.
Bitway Price Prediction: Bear, Base, and Bull Scenarios
| Timeframe | Bear Case | Base Case | Bull Case | Probability | Invalidation |
| 7 Days | $0.354–0.450 | $0.500–0.610 | $0.650–0.831 | Bear 30% / Base 45% / Bull 25% | Daily close below $0.354 |
| 30 Days | $0.198–0.274 | $0.450–0.650 | $0.879–1.071 | Bear 30% / Base 45% / Bull 25% | Weekly close below $0.317 |
| Early 2027 | $0.078–0.128 | $0.650–1.000 | $1.626–2.200 | Bear 25% / Base 45% / Bull 30% | Loss of higher-low structure since August 2026 |
A higher-low structure means each pullback bottoms out above the previous one, a sign buyers keep stepping in earlier. Losing that pattern would flip the trend.
The base case for this Bitway price projection leans toward consolidation rather than an immediate continuation of today's move. Overbought readings this extreme rarely go straight up from here.
But rarely doesn't mean never. And short covering can still push the price further before sellers regain control. For an alternate near-term target set, this futures listing surge analysis offers a bullish counterpoint worth weighing against the base case above.
Risks That Could Break This Forecast
Liquidity is thin. Only 0.14% of market cap sits in accessible liquidity, so large orders can move price fast in either direction.
Whale concentration above 99% means a handful of wallets could reshape the chart with one transaction.
Vesting unlocks add supply every month for roughly four years, and that supply has to find buyers.
Could BTW hold above $0.50 through the weekend? Nobody knows for certain, and anyone claiming they do is guessing.
Conclusion
The Bitway price projection for the near term hinges on whether this 67% move was a squeeze or the start of something bigger.
Evidence points to a squeeze amplified by a genuine staking catalyst. Trading volume, RSI extremes, and thin liquidity all point toward a cooling-off period before the next real move.
The base-case scenarios above stay grounded in that reality, not in the excitement of a single green candle. For ongoing coverage as this setup develops, crypto news section tracks Bitway alongside broader market catalysts, and the exchange listing tracker is worth bookmarking if BTW lands on additional venues.
Disclaimer
This article is for informational purposes only and does not constitute financial, investment, or trading advice. Cryptocurrency markets, including Bitway (BTW), are highly volatile, and prices can move sharply in either direction.
Scenarios, targets, and probabilities discussed above are estimates based on available data at the time of writing and are not guarantees of future performance. Always do your own research and consult a licensed financial advisor before making investment decisions.
Also read:







.webp)








