Dogecoin Price Prediction: This Breakout Could Send $DOGE 10X?


DOGE is stuck. Price has been drifting lower for weeks inside a falling structure, and right now it's testing the bottom edge of that slide.
Hold this zone, and a bounce toward higher levels is on the table.
Break down instead, and the coin likely revisits territory it hasn't seen in a while.
This dogecoin price prediction isn't picking a side early. It's just laying out what actually needs to happen for either outcome to play out.
Live Market Data
Source: $DOGE Market Cap Data Taken From Coingecko, data as of Aug 06, 2026. Figures may vary slightly across other tracking websites.
Liquidation Heatmap
The liquidation heatmap tells a lopsided story right now. Over the past hour, $16.70K got wiped out, almost all of it long.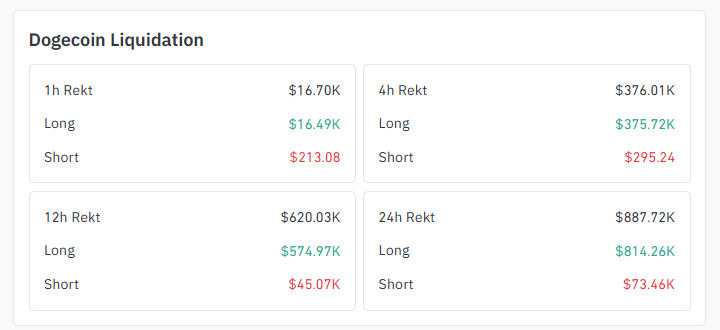
Source: Liquidation Data Taken From Coinglass.
Stretch that to four hours and it's $376.01K gone, again dominated by long positions at $375.72K against barely anything on the short side.
The 24-hour window shows $887.72K in total liquidations, with longs eating $814.26K of that. Shorts have gotten off easy this week.
That kind of imbalance usually means leveraged buyers keep getting caught leaning the wrong way every time price dips, which adds pressure on any near-term bounce attempt.
Exchange Volume
Exchange volume is heavily concentrated on two platforms.
Binance leads with $16.23M in spot turnover, followed closely by OKX at $14.94M. Gate and Coinbase trail behind at $7.67M and $5.99M. 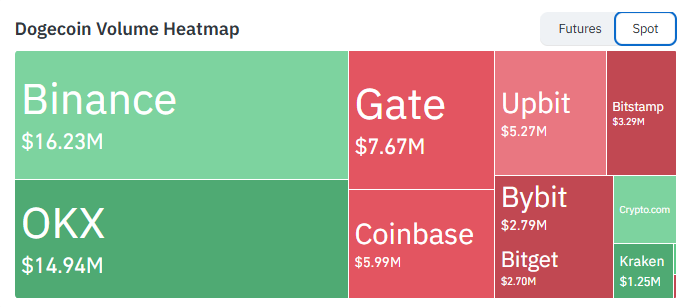
Source: Volume Heatmap Data Taken From Coinglass.
Smaller venues like Upbit, Bitstamp, Bybit, Bitget, and Kraken round out the rest, none crossing $6M individually.
This concentration on Binance and OKX means price action there tends to set the tone for the broader market.
On-Chain and ETF Flows
One shift worth watching: spot $DOGE ETFs recorded their first day of net inflows since July 21, a modest $82.64K, but a break from the recent trend. 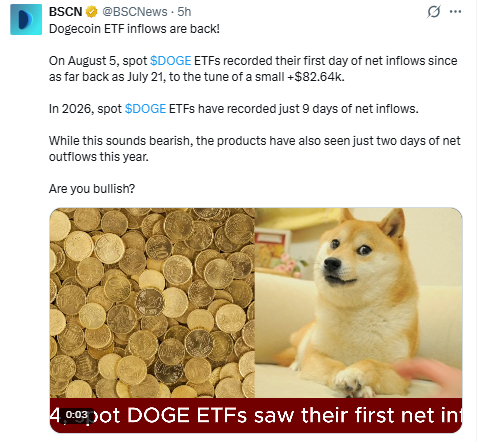
Source: Data Taken From @BSCNews, X Account.
Only nine days of net inflows have shown up across all of 2026 so far, against just two days of outflows, which is a mixed signal at best.
Circulating supply sits at 155.374B against an unlimited max supply, and the project holds a treasury of over 802 million DOGE.
Watching BTC dominance and ETH correlation alongside this matters too, since meme coins like DOGE tend to underperform whenever capital rotates back into majors.
Key Takeaways
-
$0.06972 and barely budging, that's where DOGE sits right now, boxed inside a descending channel on the daily
-
Get past $0.07940 on volume, and this dogecoin price prediction starts pointing toward $0.08507, maybe $0.08915 if momentum holds
-
Longs have been getting hammered; over $814K wiped out on leveraged buys in just 24 hours
-
The first net inflow day for spot DOGE ETFs since July 21 just happened; it was a small number but a shift worth noting
-
Nearly 9 out of every 10 dollars liquidated today came from long positions, so bulls are the ones paying right now
Technical Analysis
1-Hour Chart Analysis of $DOGE
Any solid dogecoin price prediction starts with the chart, not the news cycle.
Look at the 1H chart , and $DOGE is coiled inside a tight consolidation box, sitting right where a longer descending trendline would be. 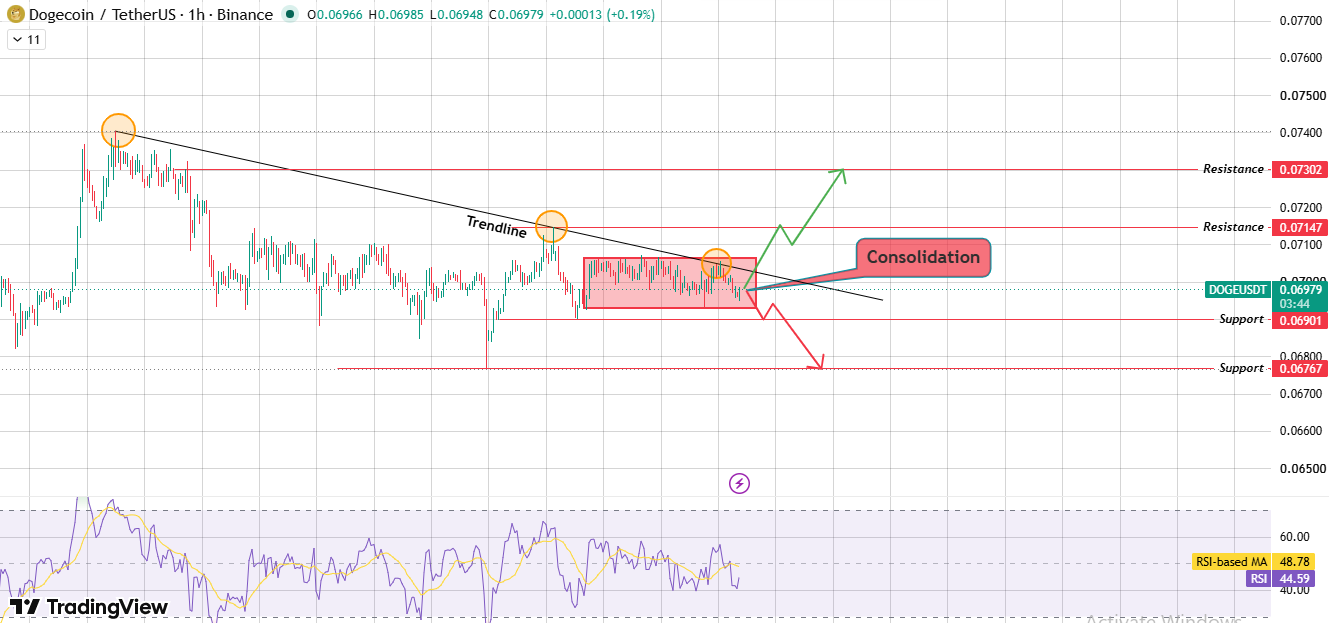
Source: Chart Taken From TradingView.
RSI reads 44.59 against a 48.78 moving average, leaning weak but not collapsed.
A push above the trendline of the first level to watch $0.07147 opens the door to $0.07302.
Fail here and $0.06901 becomes the next test, with $0.06767 lurking below that.
Dogecoin Daily Chart Analysis
Zooming out to the daily and the bigger picture shows a clean descending channel, with the price grinding lower since the last local top.
$DOGE is now pressing against the lower boundary of that channel. 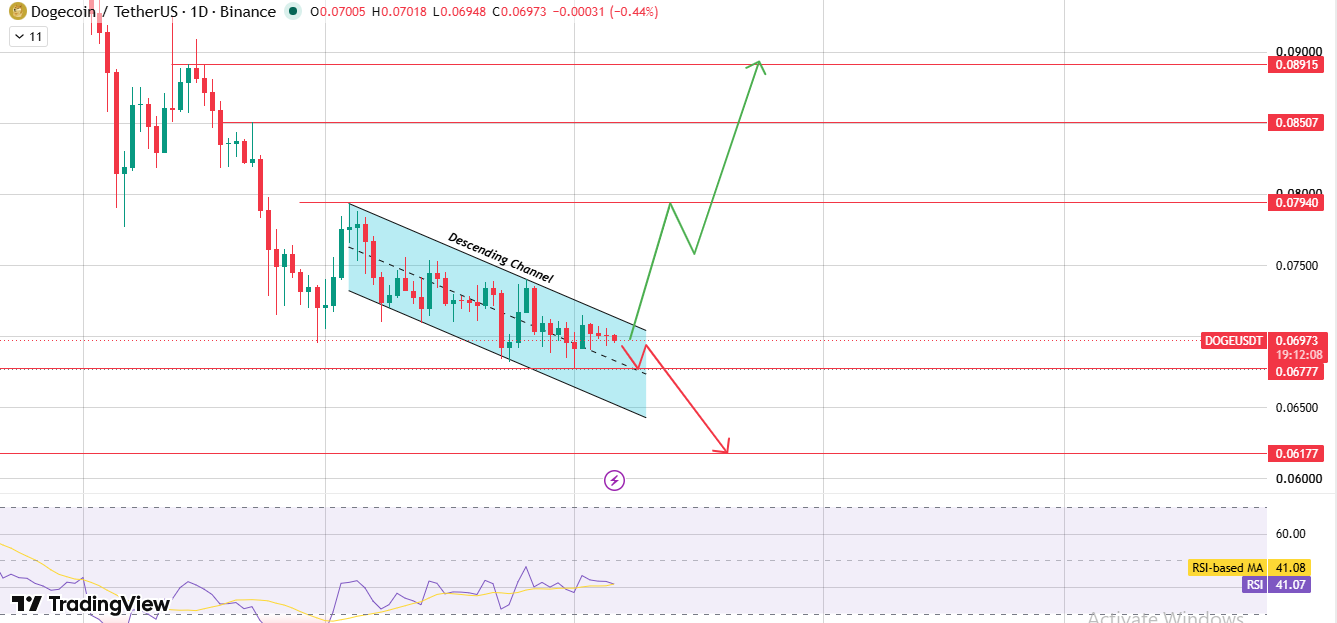
Source: Chart Taken From TradingView.
Break it cleanly with volume, and the path opens toward $0.07940 first, then $0.08507, with $0.08915 as the stretch target.
Fail to break out, or worse, lose the channel floor entirely, and $0.06177 comes into view.
RSI at 41.07 versus a 41.08 average shows momentum is basically flat right now, with neither side in control.
Bull, Base, and Bear Cases
Invalidation: the bull case dies if DOGE keeps rejecting at the $0.07147 to $0.07302 zone on the 1H chart without follow-through. The bear case gets invalidated if buyers step in and defend $0.06901 on repeated tests.
Expert Opinion
Commentators tracking the ETF data have framed the return of inflows cautiously rather than as confirmation of a trend reversal.
The general read is that one positive day doesn't undo weeks of thin flows, though some see it as an early signal worth watching if it repeats for this month's dogecoin price prediction.
Risks
Any dogecoin price prediction right now has to account for a few things.
The heavy long liquidation bias suggests leveraged buyers are still fighting the trend.
BTC dominance strength could keep dragging $DOGE lower regardless of local setup. And with ETF flows still choppy, there's no clear institutional tailwind yet to lean on.
Glossary
Descending Channel: Price sliding lower between two parallel trendlines, bouncing off both edges until one finally gives way.
Symmetrical Triangle: Two trendlines squeezing toward each other, kind of a coiled spring before the market picks a direction.
Liquidation Heatmap: Basically a map of where over-leveraged traders got forced out of their positions and how much got wiped out doing it.
Support Zone: The price area where buyers have shown up before, stepping in to catch the fall.
Price Target: Where a pattern or trend suggests price could head next, assuming things play out the way the setup implies.
Disclaimer: This article is for informational purposes only and does not constitute financial advice. Cryptocurrency markets are highly volatile. All price levels referenced are derived directly from TradingView chart data, and liquidation figures come from Coinglass. Always conduct independent research before making investment decisions.


















