MEET48 Price Prediction (IDOL): Breakout Rally or Fakeout?

A small idol-economy token just woke up, and the timing is not an accident. Somewhere between a livestream announcement and a wave of fresh buyers, a quiet chart turned into a talking point. What tipped it over, and does it have legs? That is what this MEET48 price prediction is digging into.
Why Is MEET48 IDOL Suddenly the Center of Attention Tonight?
Fandom and blockchain do not usually share a sentence, but this token keeps forcing the comparison. It runs on real fan voting, real livestreams, and real spending from people who show up for their favorite idols, not for a whitepaper. And tonight, one of those events is live again, which is exactly why a fresh MEET48 price prediction (IDOL) matters right now.
That matters because this project has a pattern. Every time a big voting round or idol showcase lands, the token wakes up with it. We have watched this happen before, and the setup right now looks familiar.
So is this just event hype that fades by morning, or is something bigger building underneath? Keep that question in mind, because the chart gives a mixed answer.
Key Takeaways
-
IDOL trades near $0.0175 as of 17:26 UTC on July 23, 2026, up roughly 16% in 24 hours.
-
The 4-hour chart shows a breakout inside an ascending channel, but RSI at 71.54 flags overbought conditions.
-
The weekly chart is still stuck inside a longer descending channel, with RSI at 42.71, below the midline.
-
Immediate support sits near $0.01456, with deeper support at $0.01205 to $0.01214.
-
Immediate resistance sits near $0.02407, then $0.02866.
-
The top three wallets alone hold close to 59% of the total supply, a serious concentration risk.
-
Tonight's IDOL Space No.61 livestream and MIPC voting event is the likely near-term catalyst.
Table of Contents
-
MEET48 Price Today: Live Snapshot
-
What Is Driving The IDOL Rally
-
The Evidence: Volume, Liquidations, and Exchange Flow
-
Technical Analysis: 4-Hour Chart
-
Technical Analysis: Weekly Chart
-
Tokenomics and Whale Concentration
-
Liquidity and Exchange Distribution
-
MEET48 Price Prediction: Bull, Base, Bear Scenarios
-
Forecast Table: 24H, 7D, 30D, 2026
-
Key Risks
-
Glossary
-
Methodology and Disclaimer
MEET48 Price Today: Live Snapshot
IDOL trades around $0.0175 as of 17:26 UTC on July 23, 2026, per MEET48 live market data tracked on CoinMarketCap. That is a gain of about 16% on the day, a far sharper move than the broader market, where the bitcoin price outlook stays comparatively calm.
Here's the thing: the direction right now is up, but the picture splits by timeframe. In the short term, momentum favors buyers. Longer term, the token is still fighting a downtrend that started back in September 2025.
Base case for the next few sessions: a push toward the $0.0207 to $0.0241 resistance zone, followed by a cooldown. Key support to watch sits at $0.01456. Lose that, and the bullish case gets shaky fast. The primary invalidation level for the near-term bullish thesis is a clean 4-hour close below $0.01456.
What Is Driving The IDOL Rally
Breaking: MEET48's official announcement confirmed tonight's event. IDOL Space No. 61 goes live. Guest idol Yang YuXin, from SNH48, joins the stream. Time slot: 21:00 to 22:00 (UTC+8), July 23, 2026. Voting for the MIPC competition runs alongside it.
That is not a random detail. MEET48's token gets its real demand from these idol voting rounds, where fans lock up IDOL to cast votes. Past events have moved the price by triple digits in a single week. Traders tracking similar catalysts across the market often check the crypto events calendar to line up token unlocks, votes, and listings before they happen.
We pulled up the historical pattern before writing this, and it holds. Big voting windows tend to pull IDOL volume up sharply in the 24 to 48 hours around the event. Tonight fits that mold.
But hype events fade. And the real test comes after the stream ends, when the voting tokens either get held, sold, or recycled back into the market.
The Evidence: Volume, Liquidations, and Exchange Flow
Turns out, the volume numbers back up the story. 24-hour trading volume sits near $15.65 million, up about 753% from the prior day, per CoinMarketCap. Vol/Mkt Cap now reads 69.63%, an unusually high ratio for a token this size.
Leverage traders got caught out too. Liquidation data on Coinglass shows $710.78K wiped out over the last 4 hours, split between $375.36K in longs and $335.42K in shorts. Almost identical totals show up across the 12-hour and 24-hour windows, which tells us most of that flush happened in one short burst, not spread evenly across the day.
Exchange flow leans heavily toward Binance. The spot volume heatmap shows Binance carrying roughly $52.89 million, well ahead of BingX at $7.34 million and Bitget at $4.87 million. Gate, LBank, MEXC, Bitunix, and KuCoin split the remainder. Sudden volume spikes like this are not unique to IDOL; a similar pattern showed up when the broader crypto market rallied on renewed risk appetite.
Whales noticed first.
Technical Analysis: 4-Hour Chart
On the 4-hour IDOL/USDT chart on TradingView, IDOL has been climbing inside an ascending channel since early July, a pattern where both the highs and lows step upward in a parallel band. Price just broke sharply above the channel's middle band with a strong green candle, gaining over 15% in that single session.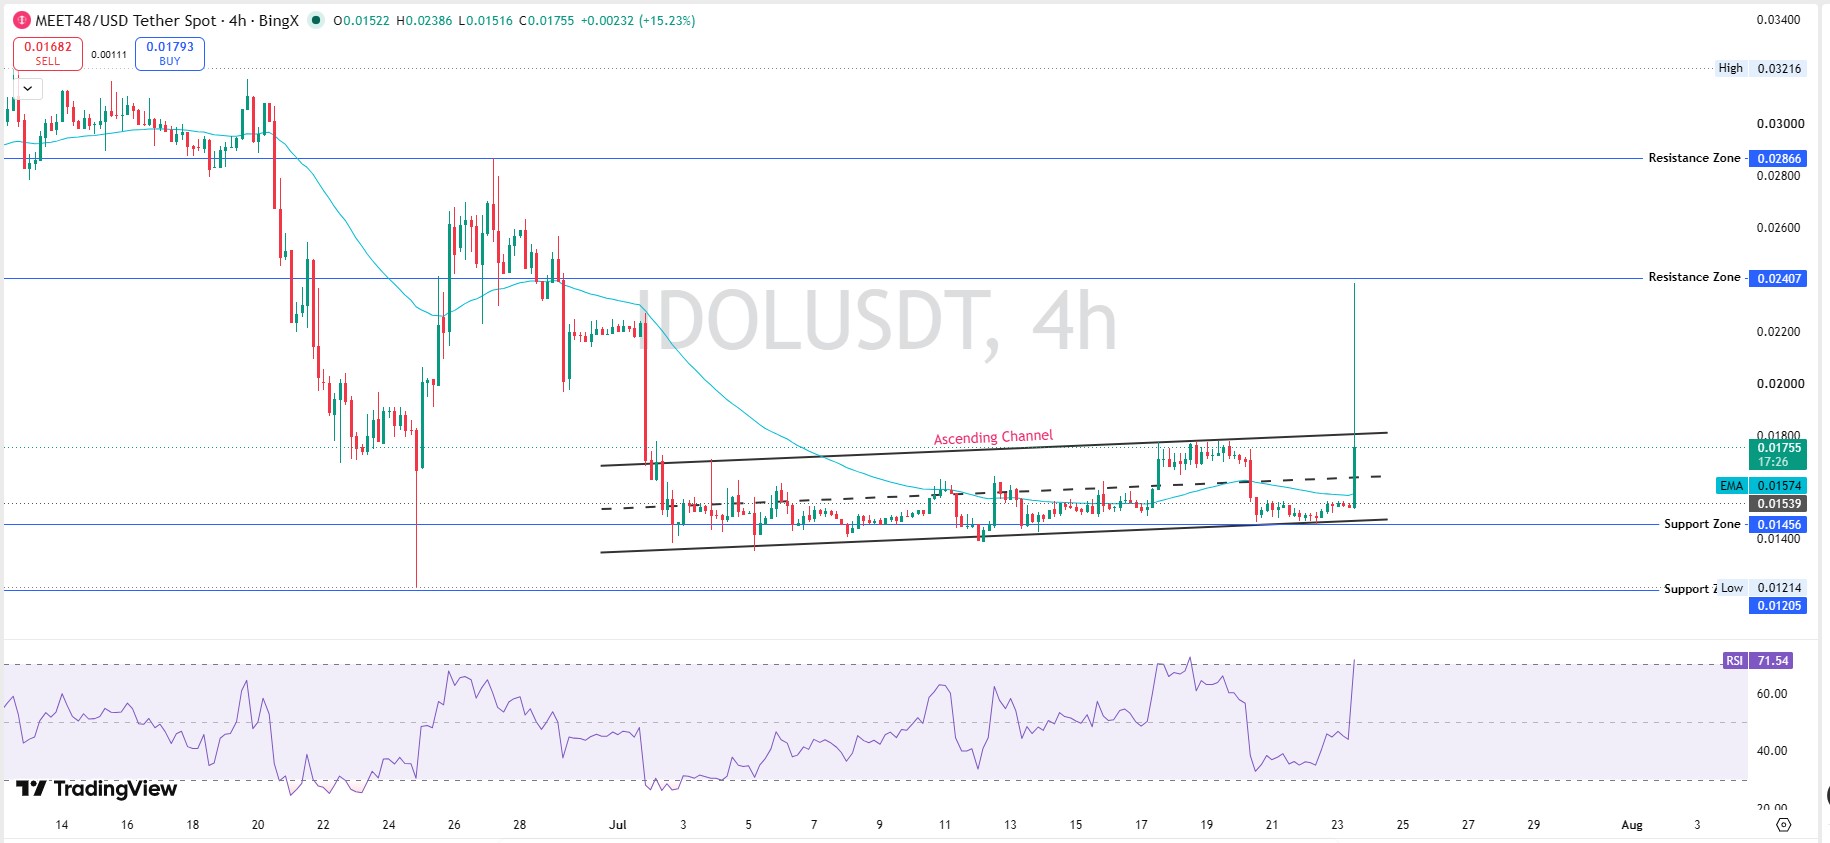
The 4-hour RSI, or Relative Strength Index, a momentum gauge that runs from 0 to 100, sits at 71.54. Above 70 usually means a market is overbought, meaning it has moved up fast enough that a short-term pullback becomes more likely.
Price is also trading well above its 4-hour EMA, or exponential moving average, a trend line that reacts quickly to recent price moves. That EMA sits near $0.01574, and a slip back toward it would not break the broader uptrend.
Resistance zones stack up at $0.02407 and $0.02866. Support zones sit at $0.01456, then $0.01214 to $0.01205. Fine.
Technical Analysis: Weekly Chart
This looks straightforwardly bullish on the smaller timeframe. Actually, wait, the weekly chart tells a different story, and it matters more for anyone thinking beyond a few days.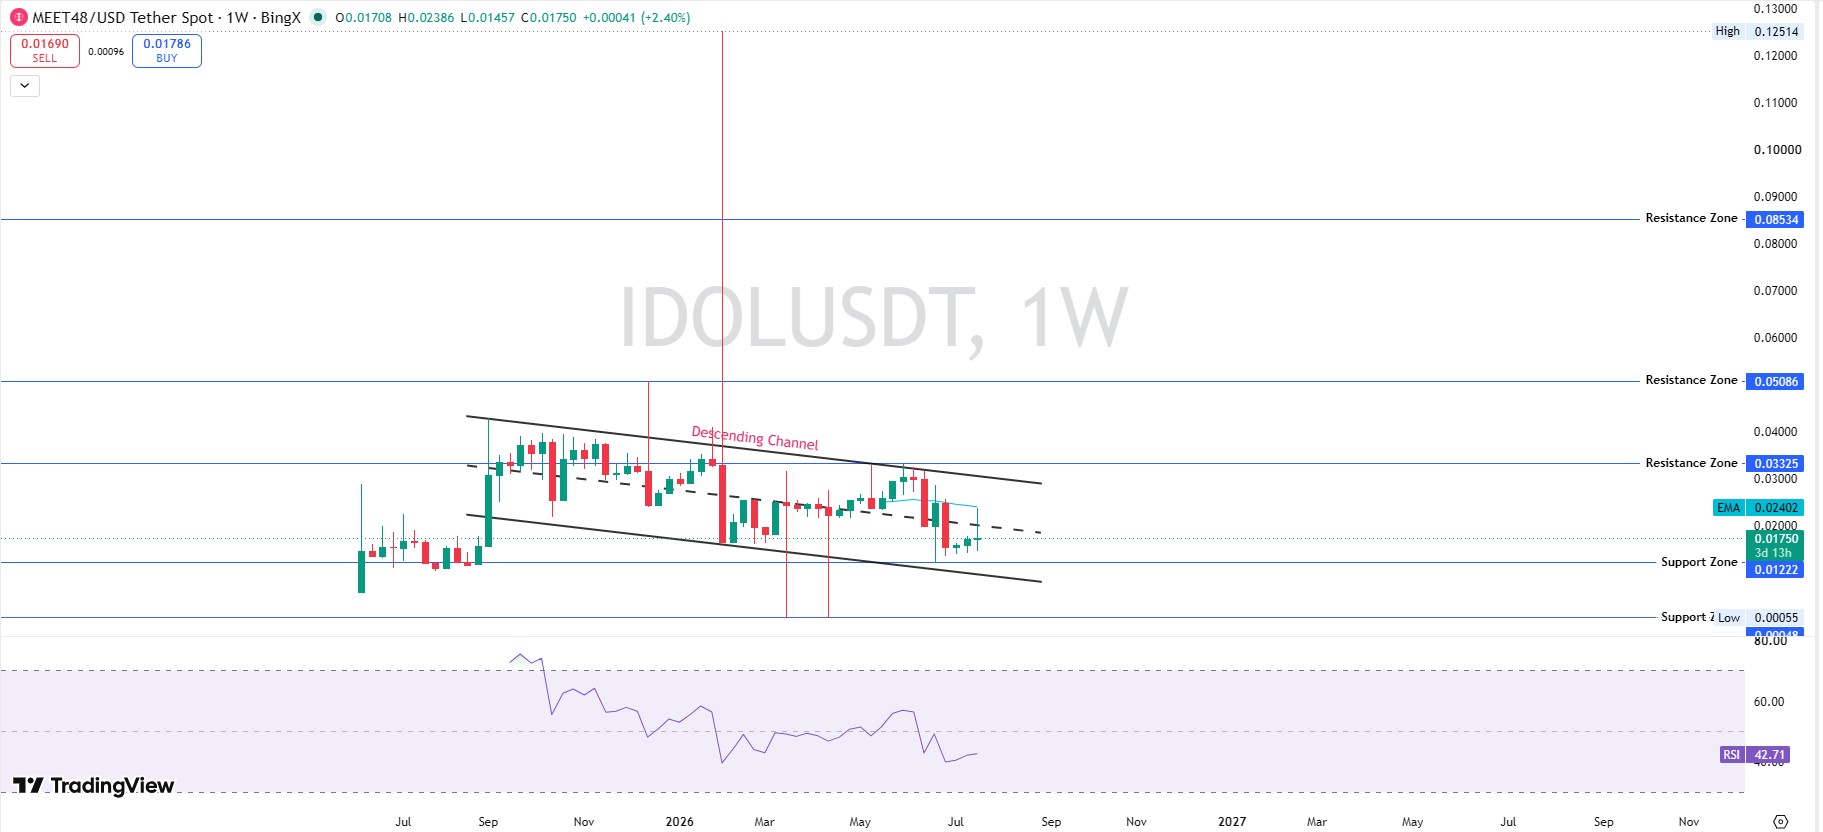
On the weekly IDOL chart, IDOL has been inside a descending channel since its September 2025 peak, meaning both highs and lows have been sliding lower for months. Today's bounce has not broken that structure yet.
Weekly RSI reads 42.71, still below the neutral 50 line. And the weekly EMA sits near $0.02402, well above the current price, which means the bigger trend has not flipped yet. Larger-cap tokens are working through similar multi-month structures right now too, as laid out in this Ethereum price outlook.
Resistance on this timeframe stretches far overhead, at $0.03325, then $0.05086, then $0.08534. Support sits near $0.01222. That is a wide gap between where price sits now and where the weekly trend would need to reclaim before anyone calls this a full trend reversal.
Tokenomics and Whale Concentration
Here's the thing: IDOL's holder data on BscScan tells a story the price chart does not. BscScan lists 314,085 total holders and more than 6.4 million transfers in the last 24 hours, both signs of an active, retail-heavy network. Concentration risk like this is worth watching alongside other fast-moving altcoin market tokens, where thin float can exaggerate both rallies and drawdowns.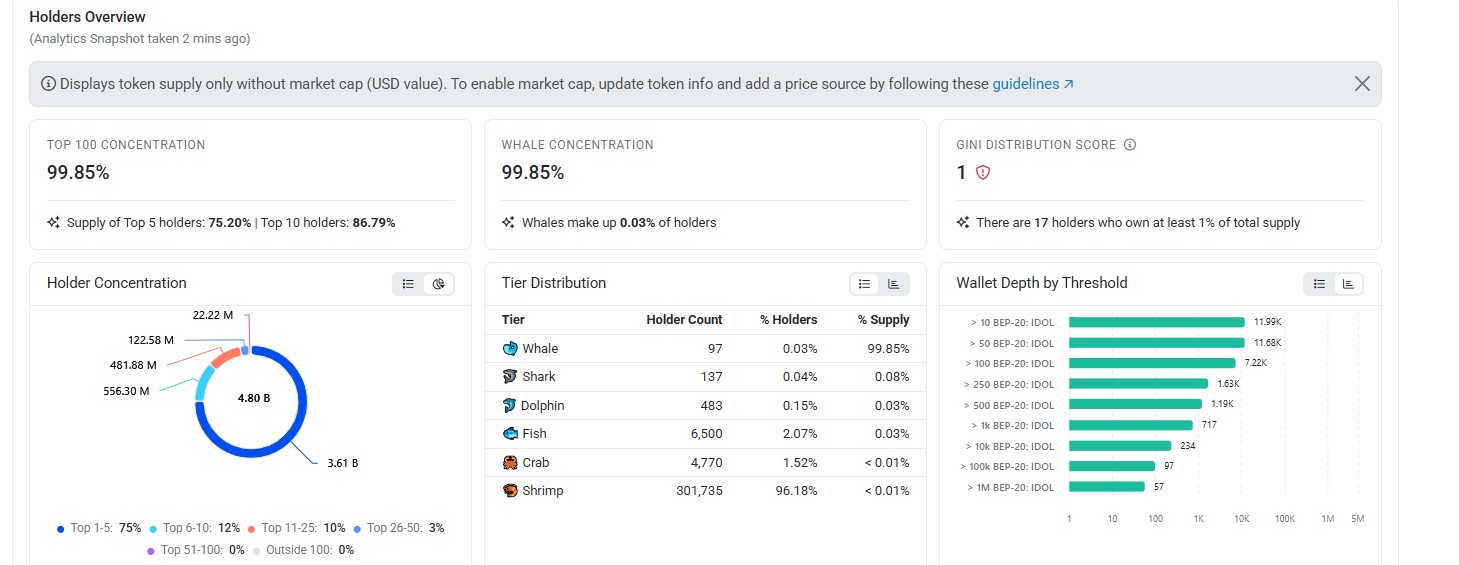
But ownership is anything but spread out. The top 5 wallets alone control 75.20% of total supply. The top 10 control 86.79%. A wallet analytics snapshot puts the Gini Distribution Score, a measure of supply inequality where lower scores mean more concentration, at just 1 out of 10.
Just 97 wallets, or 0.03% of all holders, are classified as whales, yet they hold 99.85% of the circulating supply. Seventeen holders individually own at least 1% of the total token supply each.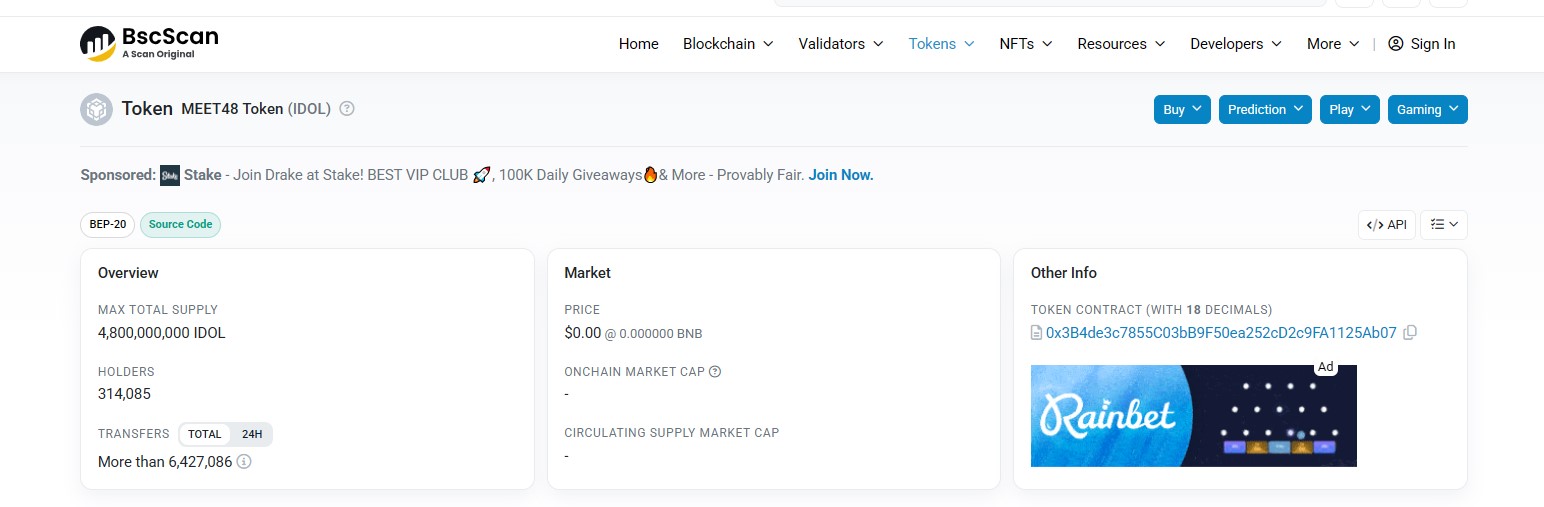
The single largest wallet, address 0x3B4de3c7855C03bB9F50ea252cD2c9FA1125Ab07 holds 1.448 billion IDOL, or 30.17% of the entire supply. The second largest holds 15%. The third holds 13.75%. Add those three together and you get close to fifty-nine percent of every token in existence, sitting in three wallets.
Two of the next largest holders are labeled exchange wallets, Binance's Alpha 2.0 Router Proxy at 8.92% and a Bitget wallet at 3.92%, which is normal for exchange custody and less of a red flag than a private, unlabeled wallet holding that much.
Noted.
Liquidity and Exchange Distribution
Fully diluted valuation, or FDV, the theoretical market cap if every token ever created were circulating today, sits near $83.95 million per MEET48 market data on CoinMarketCap. Current market cap is roughly $18.3 million, meaning only about 22% of the token's total value is actually unlocked and trading.
The liquidity-to-market-cap ratio reads 5.10%. That is thin. A ratio this low means large orders can move the price more than they would on a deeper market, in either direction. For context on how listing venues affect liquidity across smaller tokens, the broader crypto exchange landscape shows similar patterns among low-float names.
CertiK's rating on the token contract sits at 4.6 out of 5, which is a reasonably strong audit score for a BEP-20 token on BNB Chain. The contract address on BscScan is 0x3B4de3c7855C03bB9F50ea252cD2c9FA1125Ab07.
MEET48 Price Prediction: Bull, Base, Bear Scenarios
We built these scenarios off the current 4-hour and weekly structure, not off wishful thinking. Every target carries a timeframe, a rough probability, and a level that would prove the scenario wrong. It is a similar scenario-based approach to how we frame the bitcoin price forecast for the market's largest asset.
Bull case: Price clears $0.02407 resistance on strong volume and pushes toward $0.02866, then eventually the weekly resistance near $0.03325. Estimated probability over the next 7 to 30 days: around 25%. Invalidation: a daily close back below $0.01574.
Base case: Price cools off from this overbought 4-hour reading, dips to retest the $0.01456 to $0.01574 zone, then chops sideways while the market digests tonight's event. Estimated probability over the next 7 to 30 days: around 50%. Invalidation: a sustained break of either the $0.01456 support or the $0.02407 resistance.
Bear case: The weekly downtrend reasserts itself, and price slides back through $0.01456 toward the $0.01205 to $0.01222 zone. Estimated probability over the next 7 to 30 days: around 25%. Invalidation: a reclaim and daily close above $0.01755.
None of this is a guarantee. Markets do not care about our scenarios.
Forecast Table
| Timeframe | Base Case Target | Bull Case Target | Bear Case Target | Key Invalidation |
| 24H | $0.0165 - $0.0190 | $0.0207 | $0.0155 | Close below $0.01574 |
| 7D | $0.0146 - $0.0207 | $0.0241 | $0.0140 | Close below $0.01456 |
| 30D | $0.0140 - $0.0241 | $0.0333 | $0.0122 | Weekly close below $0.01222 |
| 2026 (full year) | $0.0180 - $0.0330 | $0.0509+ | $0.0100 | Loss of weekly channel structure |
The table reflects scenario-based estimates, not guaranteed prices. Always confirm live data before trading.
Key Risks
Supply concentration tops the list. When three wallets hold close to 59% of everything, one large sell order can hurt the whole market. That is not a small risk; it is the main one.
Thin liquidity compounds it. A 5.10% liquidity to market cap ratio means slippage on bigger trades can run high, especially outside the top exchanges.
Event-driven demand can also be temporary. If tonight's livestream and voting round do not bring fresh, sustained buying after they end, the rally could give back its gains quickly. Sharp reversals are not unusual once catalyst hype fades, as seen during the crypto market drawdown tied to prior geopolitical news.
And the weekly downtrend has not been broken yet. Until it is, every 4-hour bounce is technically still a bounce inside a bigger decline.
Glossary
-
RSI (Relative Strength Index): A momentum indicator from 0 to 100. Above 70 suggests overbought, and a below 30 reading suggests oversold.
-
EMA (Exponential Moving Average): A moving average that weights recent prices more heavily, used to track short-term trend direction.
-
FDV (Fully Diluted Valuation): Market cap calculated using the full max supply, including tokens not yet circulating.
-
TVL (Total Value Locked): Not directly applicable to IDOL as a fan token, but generally the dollar value locked in a protocol.
-
Open Interest: The total value of active, unsettled derivative contracts on an asset.
-
Liquidation: The forced closing of a leveraged trading position when losses hit a broker's margin threshold.
-
Invalidation Level: The specific price point at which a trading thesis is considered proven wrong.
-
Funding Rate: A periodic payment between long and short traders on perpetual futures, used to keep the contract price near the spot price.
-
Gini Distribution Score: A measure of how evenly a token's supply is spread among holders; lower means more concentrated.
Methodology and Disclaimer
Analysis basis: Technical analysis (TA) performed on IDOL/USDT spot charts, 4-hour and weekly timeframes, sourced from TradingView on BingX. Indicators used: RSI (14-period default), EMA, horizontal support and resistance zones drawn from prior price reaction points, and ascending/descending channel structures.
Data capture timestamp: July 23, 2026, 17:26 UTC. This is a live, post-launch snapshot, not a pre-listing estimate. Market data, holder counts, and liquidation figures can shift quickly given IDOL's thin liquidity, so treat exact figures as a point-in-time reference.
Disclaimer: This article is for informational purposes only and is not financial advice. Cryptocurrency markets, and low-liquidity tokens like IDOL especially, carry high volatility and concentration risks. Scenarios above are probability-based estimates, not guarantees. Always do independent research and consider your own risk tolerance before trading.
2 months ago
If you’re facing challenges accessing your cryptocurrency or investment funds, I can help. I specialize in crypto recovery and investment retrieval, offering professional support to clients dealing with: Scam or fraudulent platforms Exchanges refusing withdrawals Websites demanding additional deposits before releasing funds Lost access due to platform errors or account issues My goal is to help you recover what’s rightfully yours through safe, legitimate, and structured recovery methods. I review each case carefully, guide you through the proper steps, and help you document and escalate issues to the appropriate channels. If your funds are stuck, withheld, or you’ve been misled by a crypto platform, I’m here to assist you with a clear, professional recovery process. Feel free to reach out to us at privateintrorecovery@ gmail.com WhatsApp or text him at +17742029445


















