Official Trump Price Prediction 2030: Could TRUMP 4x?


This official Trump Price Prediction 2030 starts with a coin that's been stuck in a brutal downtrend for over a year.
TRUMP launched on the back of massive attention, then spent months grinding lower as that initial hype faded out.
Now, for the first time in a long while, the chart is flashing real signs of a turnaround, with price pushing up against a trendline that's held for over a year.
So the question everyone's asking is simple: can this coin actually claw its way back to $5 by 2030, or is this just another false start before more downside?
Why TRUMP Is Back On Traders' Radar
TRUMP is trading at $1.6711 , up 0.88%, after swinging between a high of $1.8721 and a low of $1.6353. Not a dramatic move on its own, but the location matters.
This official Trump price prediction 2030 starts with the trendline. Price has spent close to a year sliding along a descending line from late 2025, and it's now pushing up against that same line for the first time.
That's usually where a chart either gets rejected again or finally breaks through. TRUMP has clearly been weak.
The real question is whether this test marks a real recovery or just another rejection.
TRUMP Price History and Why the 2030 Story Is Still Being Written
TRUMP launched into one of the loudest debuts crypto has seen in recent memory, riding a wave of attention tied straight to its namesake.
Launches like that bring volume fast, but they also set up a brutal comedown once the initial rush fades out.
That's more or less what's played out since. The token spent months sliding from its early highs, tracing out a clean descending trendline the whole way down, with each lower high confirming sellers were still very much in control.
It's a familiar pattern for politically or personality-driven tokens: a huge initial spike, then a long, grinding reset.
What's kept TRUMP relevant through all of that isn't complicated.
It's the sheer size of its built-in audience, plus the fact that it's still one of the most recognized names in the entire sector, for better or worse.
None of that guarantees a recovery, but it does mean this coin rarely goes unnoticed for long.
Is $TRUMP still just riding on its name, or is something else holding it up?
No point dancing around it: a big chunk of TRUMP's value is tied directly to attention and name recognition, not any underlying product or utility.
That's the honest starting point for any long-term view here.
But name recognition alone doesn't usually keep an asset trading for a year and a half through a brutal drawdown.
Liquidity has stuck around, exchanges have kept their listings active, and volume hasn't vanished even during the worst stretches of the slide.
High visibility plus liquidity that refuses to dry up that combination is really what's kept TRUMP from fading out the way a lot of politically branded tokens eventually do.
What The Chart Is Quietly Signaling Beneath The Surface
Pulling up the monthly $TRUMP/USD chart on Bitstamp, one thing is impossible to miss: a long descending trendline connecting every major high since late 2025, and price is now testing that trendline from below for the first time in over a year. 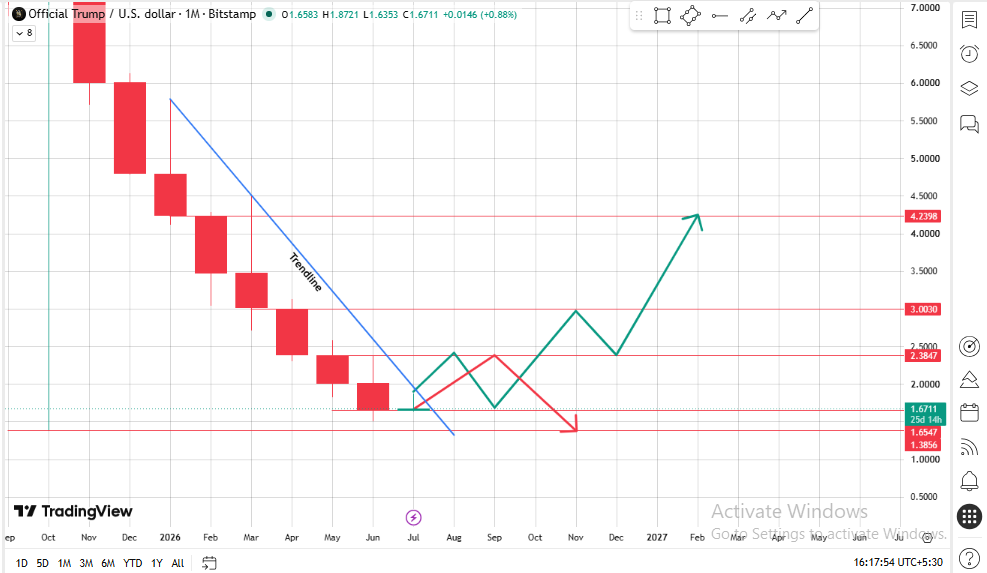
Source: Chart taken from TradingView
Price currently sits at $1.6711, just above a support cluster at $1.6547 and $1.3856.
That tight grouping right where the trendline meets recent price action is exactly the kind of area where a base tends to form, assuming one forms at all.
The chart actually lays out two very different paths from here. One shows price getting rejected off the trendline again, chopping sideways for a few months, and then rolling back over toward the $1.3856 support.
The other shows price clearing the trendline cleanly, working through a choppy climb with higher highs and higher lows, and eventually pushing through $2.3847, then $3.0030, and on toward $4.2398 if the breakout gains real momentum.
Below that support cluster, there isn't much visible structure left before price would be sitting at fresh lows for this whole move, which is exactly why the $1.6547 to $1.3856 zone matters so much right now, whichever path plays out.
$TRUMP Versus Other Politically Branded Tokens
Next to other tokens tied to public figures or political moments, TRUMP has held onto more liquidity and exchange support over a longer stretch than most of its peers, a lot of which lose relevance within months of launching.
That staying power doesn't erase the steep decline the chart shows, but it does put TRUMP in a different bucket than the typical flash-in-the-pan political coin that trades hard for a few weeks and then basically disappears.
TRUMP Short-Term Price Outlook: What Could Happen Next
In the short term, everything hinges on whether TRUMP can hold above the descending trendline it's currently testing.
A confirmed break and hold above it could open the door toward $2.3847, but a rejection back below the $1.6547 to $1.3856 support zone would put the downtrend firmly back in the driver's seat.
| Scenario | Price Target | Key Trigger |
|---|---|---|
| Bearish | $1.3856 | The trendline rejects the price again; the support zone eventually fails. |
| Base | $1.6711 | Price chops around the trendline without a clean resolution either way. |
| Bullish | $2.3847 | Price closes a full month above the descending trendline. |
Official Trump Long-Term Price Outlook Through 2030
Longer term, Trump's path depends a lot on whether attention around it keeps getting renewed periodically, the way it has in past cycles, instead of fading permanently once the initial launch buzz wears off.
Five years is a long runway for a token this tightly linked to news cycles and public attention.
| Scenario | Price Target (2030) | Catalyst Needed |
|---|---|---|
| Bearish | $1.3856 | Trendline rejection holds; attention fades permanently. |
| Base | $3.0030 | Periodic renewed interest keeps TRUMP relevant through market cycles. |
| Bullish | $4.2398 | A major renewed wave of attention pushes TRUMP back toward its historical highs. |
Worth being upfront about that, since it makes the long-term view here a lot less predictable than it would be for most other crypto assets.
Official Trump Price Prediction Year By Year: 2026 To 2030 Targets
Breaking the long-term outlook into yearly checkpoints makes it easier to follow, so here's roughly how each scenario could play out.
| Year | Bearish | Base | Bullish |
|---|---|---|---|
| 2026 | $1.3856 | $1.6711 | $2.3847 |
| 2027 | $1.3856 | $2.00000 | $3.00300 |
| 2028 | $1.3856 | $2.40000 | $3.50000 |
| 2029 | $1.3856 | $2.70000 | $3.90000 |
| 2030 | $1.3856 | $3.00300 | $4.23980 |
A couple of things jump out here. The bearish path barely moves at all; it just settles at the current support floor and stays there.
The base and bullish paths need repeated waves of renewed attention spread across several years to actually get to those 2030 numbers, not one single rally.
Three Price Scenarios For TRUMP Worth Watching Closely
Worst Case: The descending trendline holds as resistance one more time, support at $1.3856 eventually gives way, and TRUMP settles into fresh lows as interest in the token keeps fading.
Base Case: TRUMP grinds along the trendline for a while, eventually finds a floor near the current support zone, and works through a slow multi-year recovery with the occasional burst of renewed attention.
Best Case: TRUMP breaks cleanly above the descending trendline, and a major new wave of attention, whether it's politics, media coverage, or a fresh retail rush, pushes it decisively above $4.2398 and back toward levels it hasn't seen since its original highs.
| Scenario | Price Range | What Triggers It |
|---|---|---|
| Worst Case | $1.00 – $1.39 | Trendline rejection; attention fades further. |
| Base Case | $2.38 – $3.00 | Steady multi-year recovery with periodic attention spikes. |
| Best Case | $4.24 – $5.50 | Confirmed trendline breakout and major renewed attention wave. |
Key Price Levels Every TRUMP Holder Should Watch
Resistance zone: $2.3847 to $3.0030. This is the first real test for the recovery case once the line itself is cleared, and holding above it would be the clearest sign yet that the downtrend is finished.
Support zone: $1.6547 to $1.3856. This is the floor sitting right beneath the current trendline test, and it needs to hold for any recovery story to stay believable.
Invalidation zone: below $1.3856. A clean break under this level confirms the line rejection was real and opens the door to fresh lows.
Analyst View and Final Thoughts on TRUMP's Road to 2030
The chart right now sits at a real inflection point.
A year-long descending trendline getting tested for the first time is exactly the kind of setup that either marks the start of a genuine reversal or gives way to one more leg down after a failed breakout attempt.
Which way it tips comes down to volume and follow-through, not the trendline test by itself. A break above it on thin volume wouldn't really mean much here.
Also worth keeping in mind: TRUMP is more sensitive to news cycles and public attention than most crypto assets, so outside events are likely to matter just as much as anything technical over the next few years.
If $TRUMP closes a full month above the descending line and then holds the $1.6547 to $1.3856 zone as new support, that's the clearest evidence yet the downtrend is actually breaking rather than just pausing for a moment.
The level worth watching most closely from here is $1.3856. Lose that on a confirmed monthly close, and the recovery case gets a lot harder to argue for.
Five years is a long stretch, and $TRUMP has already proven it can generate renewed attention out of nowhere before. Whether that happens again by 2030 is really the open question.
Disclaimer: This article is for educational purposes only and does not constitute financial advice. Crypto markets are volatile. Consult your investment advisor before making any investment decision.