Ondo Price Prediction: Can ONDO Rebound From $0.31 Support?


Wall Street can't stop talking about tokenization, and Ondo Finance keeps landing in the middle of that conversation, making it one of the more closely watched names in this Ondo Price Prediction.
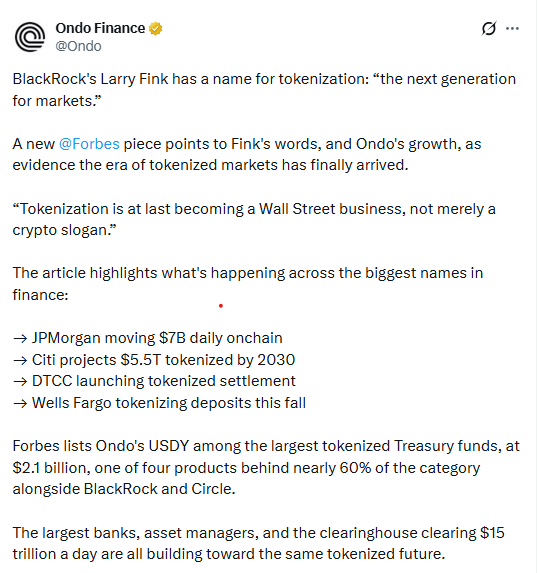
The project recently pointed to a Forbes report where BlackRock's Larry Fink called tokenization the next generation for markets, tying it to Ondo's own USDY tokenized Treasury product and the broader wave of institutional real-world asset activity.
None of that changes what the chart is doing right now, though. Any near-term Ondo price prediction has to start with where ONDO is sitting right at a support level that's about to decide its next move: $0.31.
Why Is ONDO Price Under Pressure?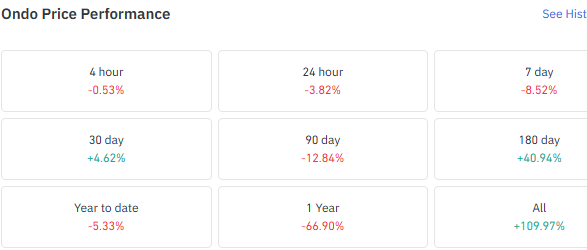
Down 3.82% in 24 hours. Down 8.52% over the week. That's a rough stretch, and it stands out even more against the 30-day number, which is still positive at 4.62%. Short-term sellers have clearly taken control, even if the monthly trend hasn't broken down.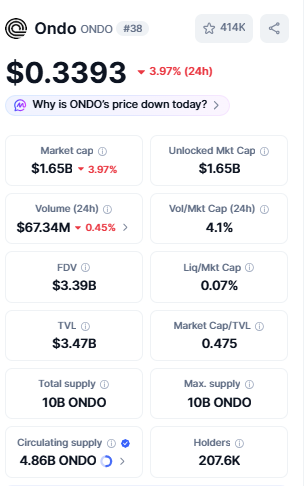
Price sits near $0.339, market cap around $1.65B, and 24-hour volume at $67.34M, with about 4.86B of the 10B total supply in circulation. The token is trading defensively here, right at a level that matters.
Data source: Coinglass/ CoinMarketCap
Are ONDO Futures Traders Betting on a Recovery?
Here's where it gets interesting. Binance's overall ONDO/USDT ratio is close to balanced at 1.0471, but zoom into the top trader accounts, and the picture shifts: 1.4033, climbing to 2.1876 for top trader positions specifically.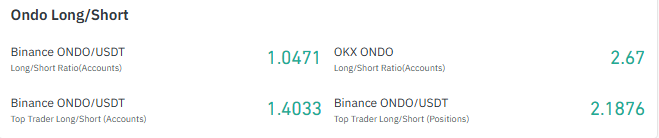
OKX's numbers lean even further long, at 2.67. Big money looks more confident than the average account right now.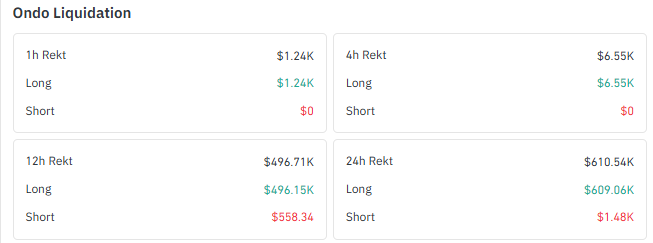
That confidence hasn't stopped the bleeding. Long liquidations hit roughly $609.06K over 24 hours, compared to just $1.48K on the short side, a lopsided ratio.
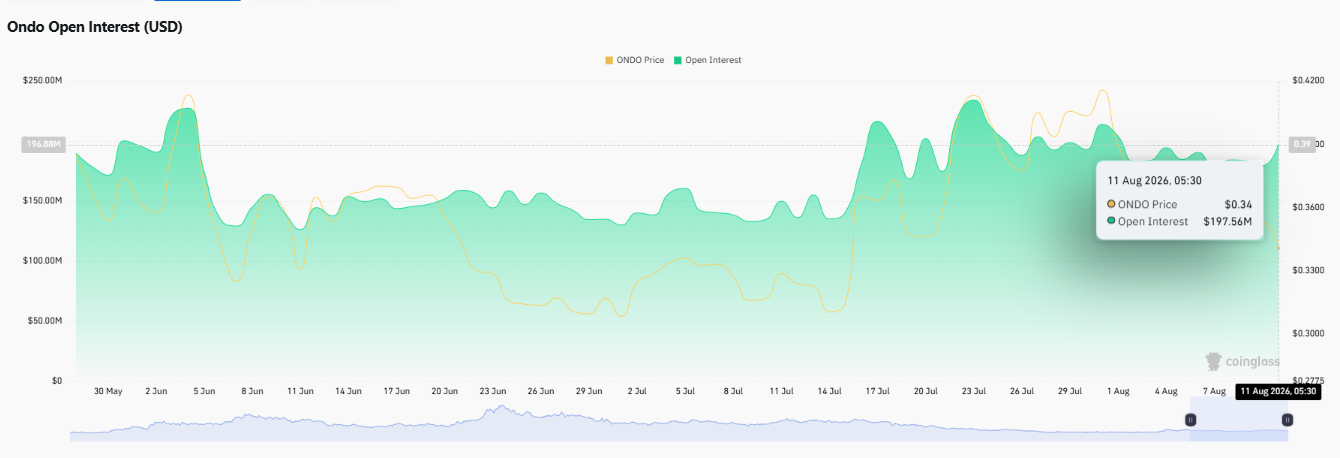
Open interest is still elevated near $197.56M (per Coinglass), meaning traders haven't left the table even as the price dropped.
Elevated open interest by itself doesn't point a direction. Top traders leaning long is a data point worth flagging, nothing more.
Data source: coinglass
Can ONDO Hold Its 4-Hour Descending Channel Support?
The 4-hour TradingView chart is stuck inside a descending channel, and price is now testing the lower edge of it.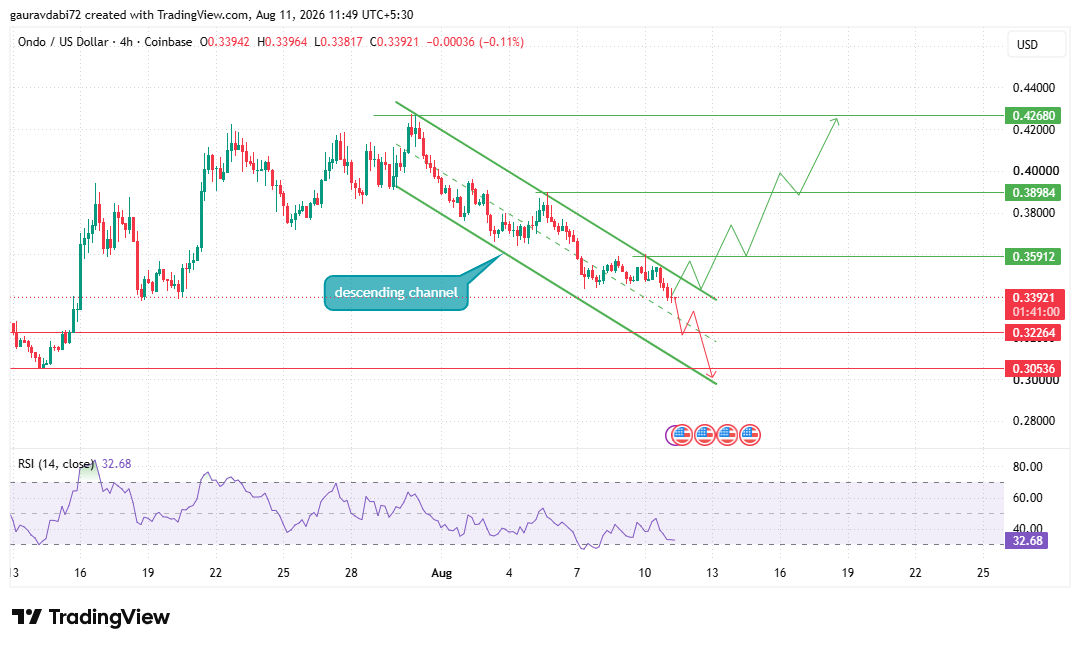
RSI reads 32.68, close to oversold but not there yet, and proximity to oversold isn't a reversal signal on its own.
Immediate support is $0.32264, then $0.30536 below that. Hold the zone, and buyers could push toward $0.35912 first, then $0.38984, with $0.42680 as the bigger recovery target further out.
Lose $0.32264, and the pressure stays on the lower boundary; a clean break under $0.30536 would do real damage to the short-term structure.
Bearish is still the fair read here, but it's edging into territory where a bounce becomes plausible if buyers actually show up.
What Does ONDO's Daily Chart Show?
Same story, longer timeframe. ONDO has spent months inside a descending channel on the daily, and an earlier attempt to break out of it fizzled and dragged price back in.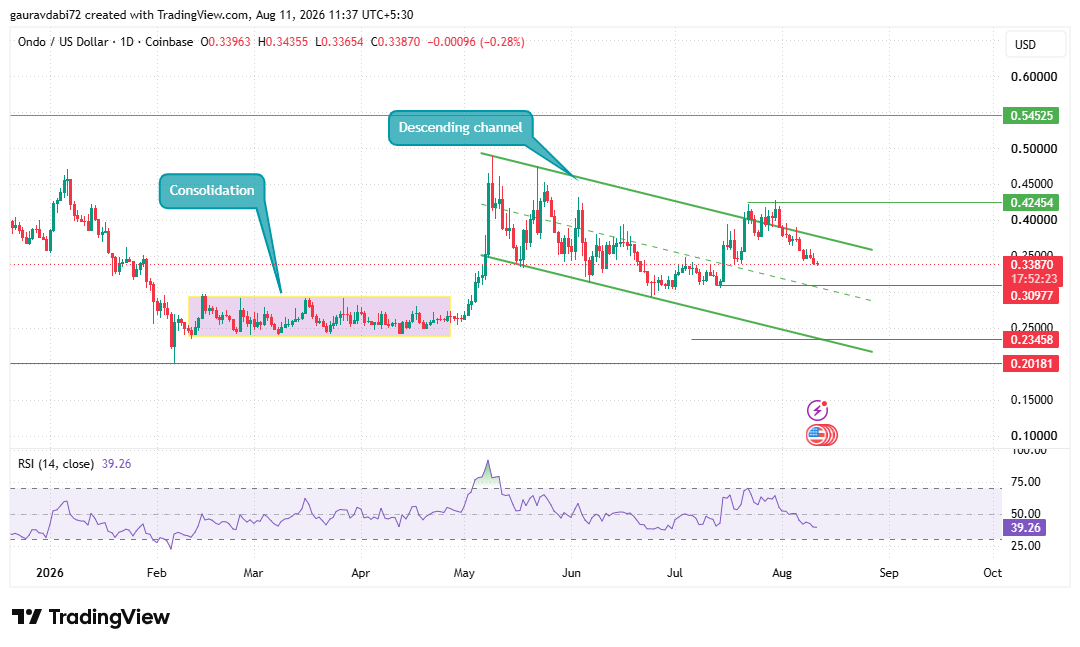
Daily RSI sits at 39.26, under the neutral 50 mark, in line with a bearish-to-neutral tone overall. Support at $0.30977 lines up closely with the 4-hour level at $0.30536, so really it's one broader zone: $0.305 to $0.310.
Hold that, and $0.42454 becomes the level to watch on the upside, with $0.54525 sitting out there as a much bigger ask that would need serious confirmation.
Break it, on the other hand, and $0.23458 comes into view, with $0.20181 possible beyond that.
Data source: TradingView
Overall Technical Sentiment: Bearish to Neutral
Both timeframes are stuck in descending channels. Both RSI readings sit under 50. That's bearish to neutral, plain and simple.
But ONDO is also parked right at a major support shelf, so betting on further downside without seeing a break first would be getting ahead of the chart.
Ondo Price Prediction: Three Scenarios to Watch
Scenario | Technical Trigger and Levels |
Bullish | ONDO defends the $0.305–$0.310 support region and begins recovering. The 4-hour path initially points toward $0.35912 and $0.38984, with the $0.424–$0.427 resistance zone becoming the major higher resistance area. |
Base | ONDO remains inside its descending channels and consolidates near support while traders wait for stronger price confirmation. |
Bearish | A confirmed breakdown below the major $0.305–$0.310 support region increases downside risk, with the daily chart exposing $0.23458 and potentially $0.20181. |
What We're Watching Next
As per the Coin Gabbar analyst, the setup right now comes down to one question: does the $0.305 to $0.310 zone hold?
A recovery above $0.35912 would be the first real sign that momentum is shifting. Getting through $0.424 to $0.427 is the tougher ask, the one that would actually mean something structurally.
Lose the support zone instead, and $0.23458 becomes the next thing to watch. Volume and how long positions behave under further selling pressure will tell most of the story from here.
Disclaimer: This article is for informational purposes only and is not financial or investment advice. Cryptocurrency markets are volatile, and readers should do their own research before making trading or investment decisions.

















