CYS Price Prediction: Upbit Listing Fuels Cysic Rally


CYS just jumped 38.1% in 24 hours after a new Upbit listing, closing in on its all-time high. But the weekly RSI is deeply overbought at 78.69, while the 4H chart looks calmer, and 83.92% of supply is still uncirculated with no unlock schedule disclosed. Here's the full CYS price prediction, with key levels, risks, and a bear, base, and bull forecast.
Key Takeaways
Cysic (CYS) is up 38.1% in 24 hours to $1.29, sitting just 0.41% below its Aug 11, 2026, all-time high of $1.35.
The rally lines up with Upbit Korea's announcement of new CYS/BTC and CYS/USDT trading support starting Aug 10, 2026, 14:00 KST (05:00 UTC).
The weekly chart is inside an ascending broadening wedge, with RSI (14) at 78.69, deep in overbought territory.
Key resistance sits at $1.52–$1.85; key support sits at $0.9080.
The biggest risk is supply and infrastructure: only 16.08% of the 1 billion max supply is circulating with no disclosed unlock schedule, and Cysic's own bridge is mid-update after flagged issues.
CYS Price Prediction: Upbit Listing Fuels Cysic Rally
CYS price prediction interest has spiked after Cysic (CYS) jumped 38.1% in 24 hours to trade near $1.29 as of Aug 11, 2026, 16:00 UTC, pushing the token to within 0.41% of its own all-time high. For a deeper look at how this move fits the token's longer breakout structure, the breakout target analysis tracks the same setup in more detail.
Market Overview: Price Action and Volume
According to CoinMarketCap, CYS traded at $1.29 (+38.1% 24h) with a market cap of $208.33M (+38.1%) and 24-hour volume of $95.26M (+18.77%), putting the Vol/Mkt Cap ratio at 43.76%. The token is 0.41% below its Aug 11, 2026 all-time high of $1.35 and 973.91% above its Jan 30, 2026 all-time low of $0.125.
Futures-market activity tells a similar story: per CoinGlass, Binance carries the largest share of CYS futures volume at $288.12M, followed by Bybit and Bitget, with smaller volume spread across MEXC, Gate, Bitunix, and Aster.
Catalyst: New Upbit Trading Support
The immediate trigger is Upbit Korea's listing post, confirming new CYS/BTC and CYS/USDT market support starting Aug 10, 2026, 14:00 KST (05:00 UTC).
New exchange access for a mid-cap token tends to pull in fresh volume fast, which is exactly what shows up here. Fresh listings on major venues are a recurring driver this cycle, and tracking upcoming exchange support announcements is one way to anticipate similar setups before they play out.
Tokenomics and Network Activity
Cysic has a total and max supply of 1 billion CYS, with only 160.8 million (16.08%) circulating, putting fully diluted valuation at $1.29B against a $208.33M market cap, a wide gap that signals future dilution risk. 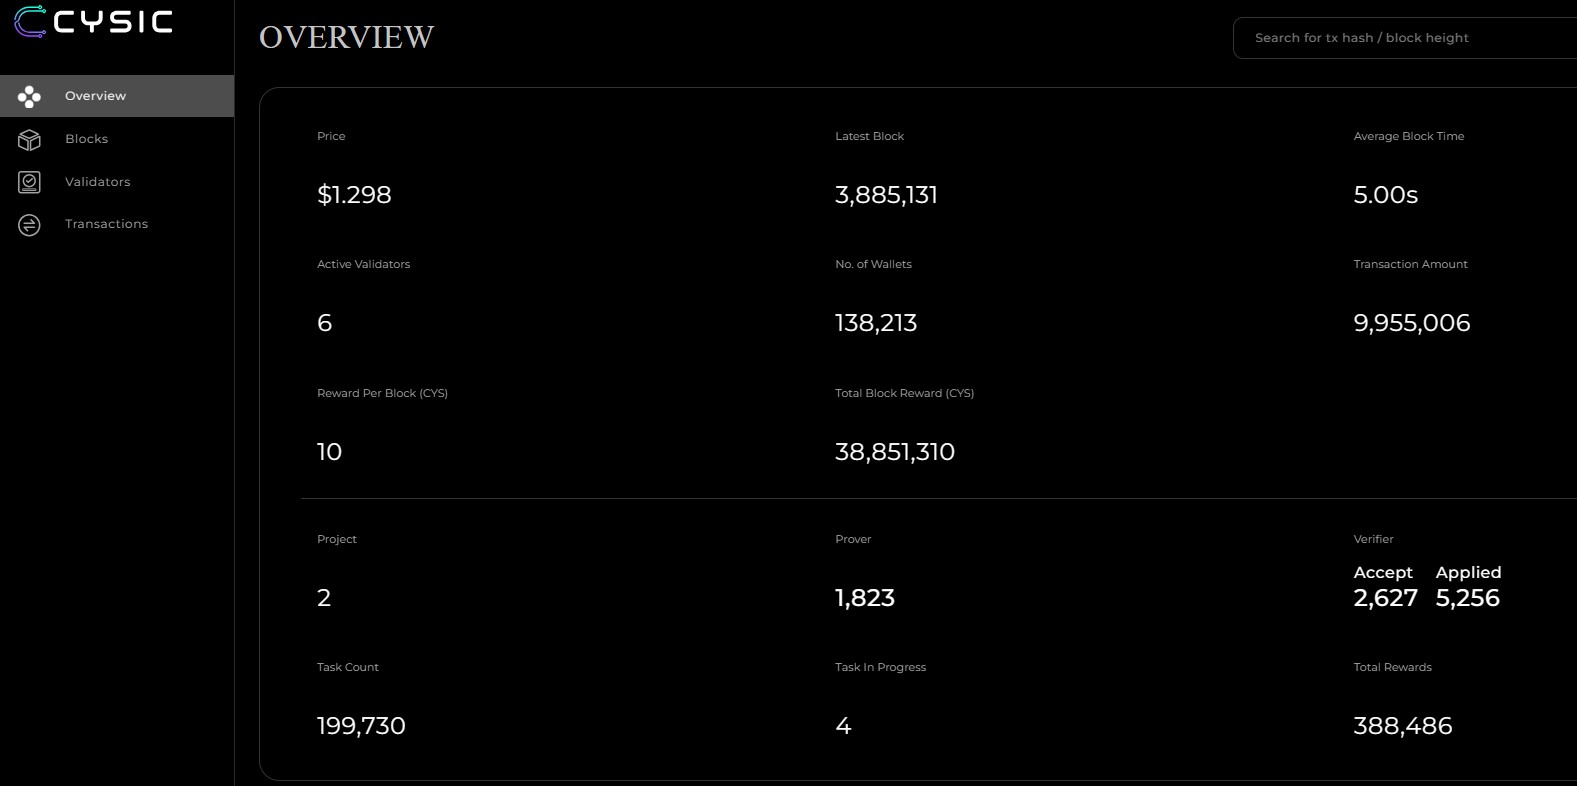
On the infrastructure side, Cysic's on-chain explorer shows 138,213 wallets, six active validators, and roughly 9.96 million transactions processed.
Cysic Technical Analysis: Key Levels
Technical Analysis: 4H Chart
The 4-hour CYSUSDT chart on MEXC, viewed on TradingView, opened at $1.3016, tagged a high of $1.3650 and a low of $1.2606, and trades at $1.3069 (+0.68%). 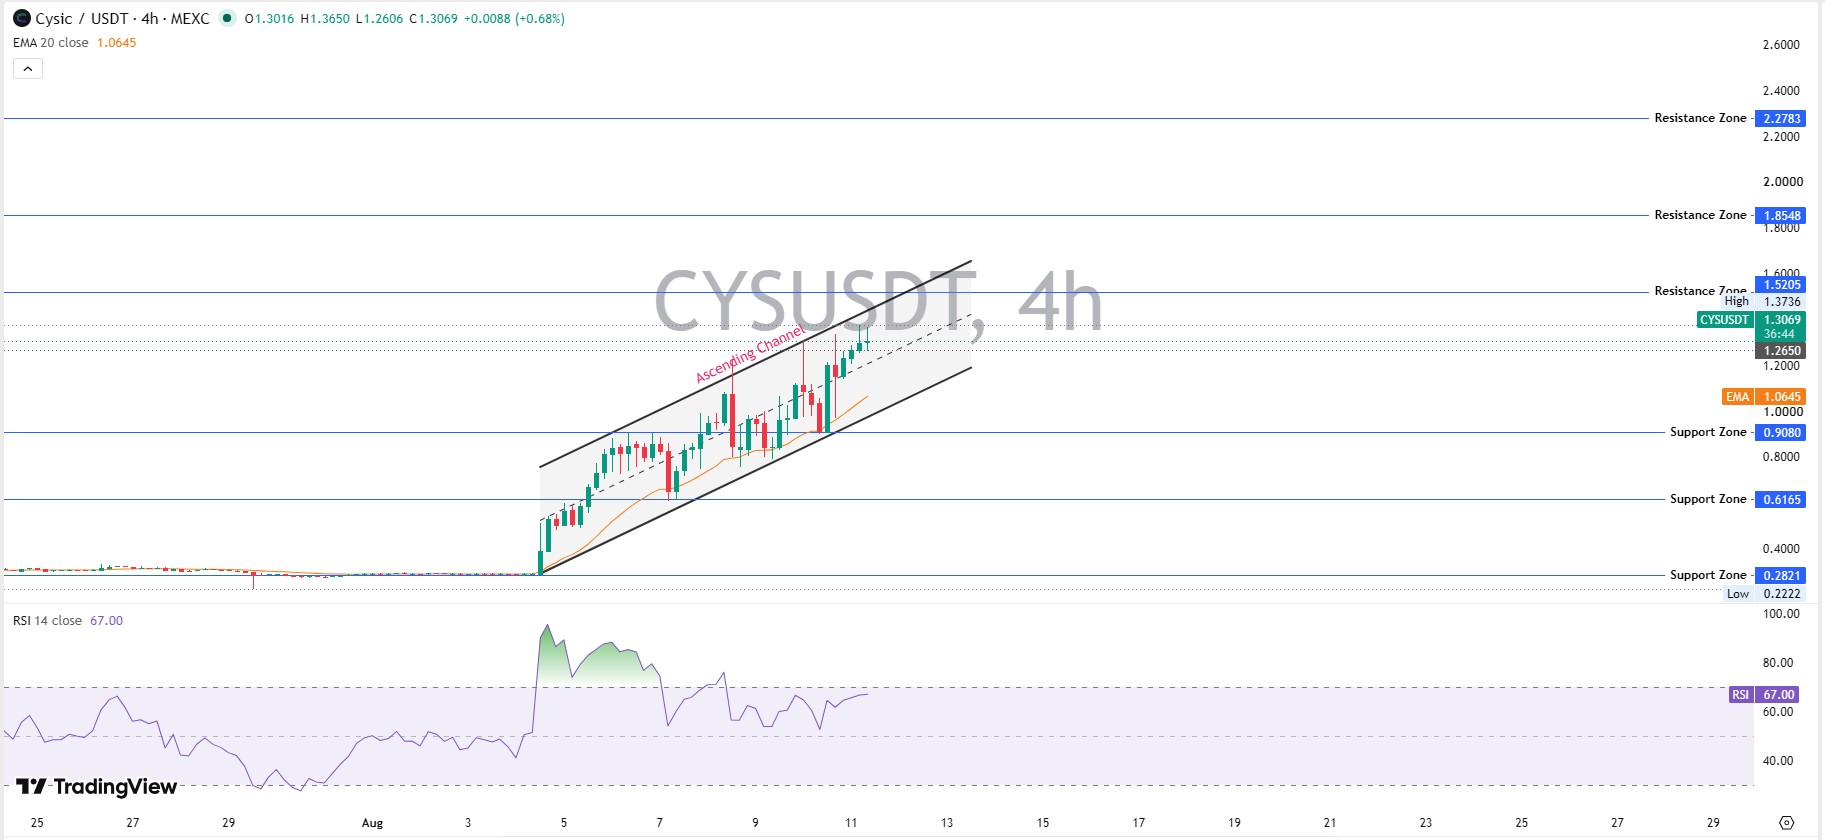
Price action over the past several sessions has carved out a clean ascending channel, a series of higher lows and higher highs bounded by two parallel rising trendlines, and the current candle sits comfortably inside that structure rather than testing either boundary.
The EMA (20) sits well below the spot at $1.0645, confirming the short-term trend remains firmly up, while the RSI (14) reads a moderate 67.00, elevated but still short of the 70 threshold that typically flags overbought conditions on this timeframe.
That combination suggests the intraday trend has room to extend before it needs to cool off. Resistance zones stack at $1.5205, $1.8548, and $2.2783 as price works higher inside the channel, while support zones sit at $0.9080, $0.6165, and $0.2821 if the structure breaks down.
Technical Analysis: Weekly Chart
The weekly chart breakdown shows the bigger picture behind this rally. CYS opened the week at $1.0804, reached a high of $1.3736, dipped to a low of $0.9000, and trades at $1.2883, up 18.50% for the week. 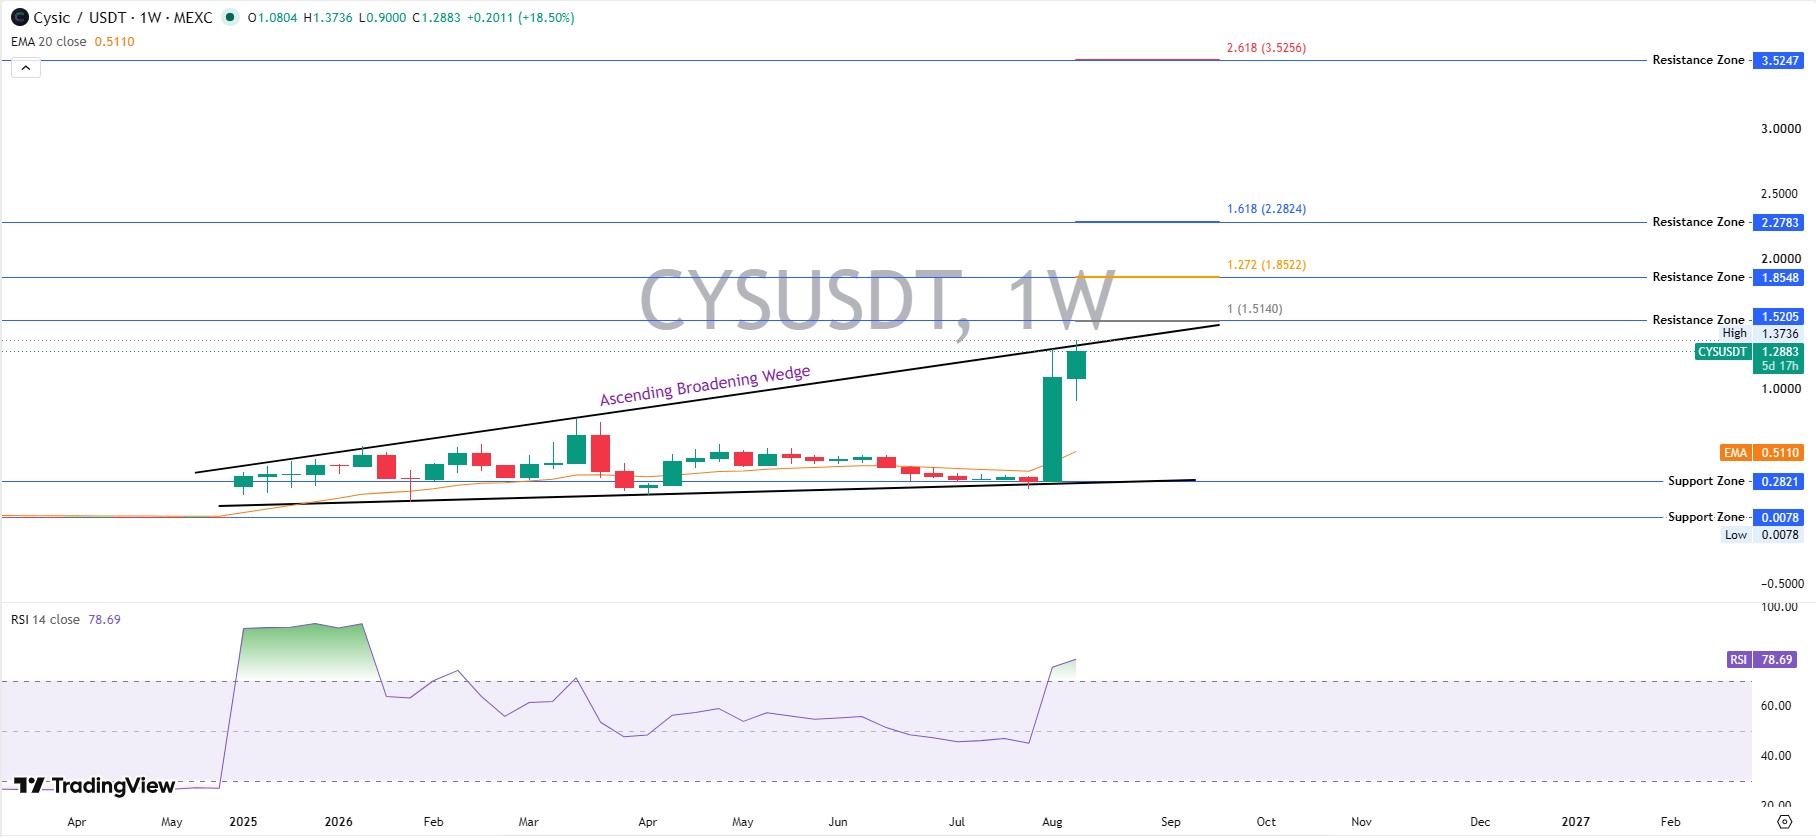
That price action sits inside an ascending broadening wedge, a pattern formed by two diverging, rising trendlines rather than the tighter parallel channel visible on the 4-hour chart, which typically signals expanding volatility alongside the broader uptrend. EMA(20) sits at $0.5110, far below the current spot, underscoring how sharply price has separated from its medium-term trend line.
RSI (14) has pushed to 78.69, solidly overbought and a level that has historically preceded at least a short pause on this chart.
Fibonacci extensions drawn from the wedge base mark resistance at $1.5205 (1x), $1.8548 (1.272x), $2.2783 (1.618x), and $3.5247 (2.618x). For a broader view of similar setups, the price prediction hub covers comparable breakout structures.
CYS Price Prediction: Bear, Base, and Bull Case
Timeframe | Bear Case | Base Case | Bull Case | Probability | Key Level | Invalidation |
7-Day | Pullback toward EMA20 near $1.06 as RSI cools from overbought | Consolidation between $1.10–$1.35 inside the wedge | Push to $1.52 resistance on continued Upbit-driven volume | 30% / 45% / 25% | $1.06 / $1.29 / $1.52 | Weekly close below $0.9080 support |
30-Day | Reversion toward $0.9080 support if listing volume fades | Range between $1.00–$1.85 as the 1.272 extension is tested | Extension to $2.28 (1.618 Fib) if exchange volume keeps climbing | 30% / 45% / 25% | $0.9080 / $1.85 / $2.28 | Loss of the ascending wedge's lower trendline |
Early 2027 | Drop toward the $0.28 support zone if the remaining 83.92% of supply outpaces demand | Consolidation between $1.20–$2.20 as future vesting supply and adoption roughly offset each other | Extension toward $3.52 (2.618 Fib) if network usage scales and bridge issues resolve cleanly | 30% / 45% / 25% | $0.28 / $1.80 / $3.52 | Circulating supply outpacing demand, or unresolved bridge issues triggering user exits |
Source: TradingView (MEXC, 4H & 1W), CoinGlass, snapshot Aug 11, 2026, 16:00 UTC
This CYS price prediction leans base-case across all three windows: the price is technically overbought on the weekly chart but structurally still inside its broadening wedge, and the Cysic forecast reflects that mixed picture rather than a guaranteed direction.
Risks and Invalidation
The single biggest risk to any bullish Cysic price prediction is supply: with 83.92% of the 1 billion max supply still uncirculated and no disclosed unlock schedule, a sudden release could outpace demand regardless of chart structure.
Derivatives data adds a short-term wrinkle: 24-hour liquidations totaled $1.49M, split between $398.03K in longs and $1.09M in shorts, consistent with a short squeeze rather than pure organic buying.
A more project-specific risk is Cysic's own bridge update, flagged mid-fix after issues turned up during a routine check; users with delayed transactions were told assets remain safe, but this is worth monitoring alongside price.
Macro conditions matter too. Developments around the Clarity Act and upcoming Federal Reserve decisions can shift capital away from mid-cap AI infrastructure.
Glossary
RSI: Momentum indicator measuring the speed of price moves; above 70 signals overbought conditions.
EMA: A trend line weighting recent prices more heavily than older ones.
FDV: Price multiplied by max supply, the total value if every token were circulating.
Liquidation: Forced closure of a leveraged futures position when losses breach margin requirements.
Ascending Broadening Wedge: A pattern formed by two diverging, rising trendlines connecting higher highs and higher lows.
Vol/Mkt Cap Ratio: 24-hour volume divided by market cap, showing trading activity relative to size.
Conclusion
Cysic's rally is real but stretched: a fresh Upbit listing and heavy short-covering are colliding with an overbought weekly RSI, a largely uncirculated supply, and an in-progress bridge fix. Anyone acting on this CYS price prediction should weigh the $1.52–$1.85 resistance band against the $0.9080 support floor and watch for any disclosure on Cysic's unlock schedule or bridge status before the next leg.
Disclaimer: This is not financial advice. Cryptocurrency markets are highly volatile; do your own research before trading.

















