PI Network Price Prediction: This $PI Setup Looks Explosive


Pi Network began years ago as a mobile-first mining app, letting everyday users tap a button daily to earn $PI without draining their phone battery.
That grassroots approach built one of crypto's largest pre-launch communities long before the coin ever touched an exchange.
The mainnet finally opened in February 2025, shifting $PI from a closed testnet token into something the open market could actually price.
In this pi network price prediction, $PI Network is currently trading at $0.08923, up 0.8% over the last 24 hours, moving inside a tight band between $0.08783 and $0.08998.
Live Market Data
Before diving into where this PI Network price prediction sees things heading, here's the snapshot as it stands right now, straight from live trading data rather than a stale cache.
| Metric | Value |
|---|---|
| Price | $0.08923 |
| 24h Change | +0.8% |
| 24h Range | $0.08783 – $0.08998 |
| Market Cap | $984.86M |
| Fully Diluted Valuation | $1.515B |
| 24h Volume | $4.837M |
| Circulating Supply | 11.042B |
| Total Supply | 16.987B |
| Max Supply | 100B |
Source: $Pi Network market cap data taken from Coingecko, data as of Aug 14, 2026. Figures may vary slightly across other tracking websites.
Social Sentiment of $PI Network
Market chatter this week centered on PI Network's addition to a Solana-based centralized exchange, joining a small batch of listings that also included an established proof-of-work chain and a newer institutional-focused network. 
Source: Data Taken From @BSCNews, X Account.
The framing from commentators was less about a single exchange and more about what it signals:
$PI is edging toward broader cross-chain accessibility, giving holders on Solana-adjacent platforms a more direct route to trade the token.
Whether that listing translates into real volume for $PI is still an open question, since new listings don't always move the needle on their own.
Key Takeaways
-
PI Network is trading at $0.08923, up 0.8% in the last 24 hours
-
1H chart flipped from a descending channel into an ascending channel, now testing $0.0908 resistance
-
The 4H chart shows a descending triangle with a recent fake breakout below support
-
A break above $0.0908–$0.09209 with volume opens the door to $0.09341–$0.09641.
-
PI Network was added to a Solana-based centralized exchange this week
Technical Analysis
1-Hour Chart Analysis for Pi Network Price Prediction
Something shifted on the 1H chart recently. $PI spent a stretch sliding inside a descending channel, the kind of steady lower-high, lower-low grind that wears sellers' patience thin eventually. 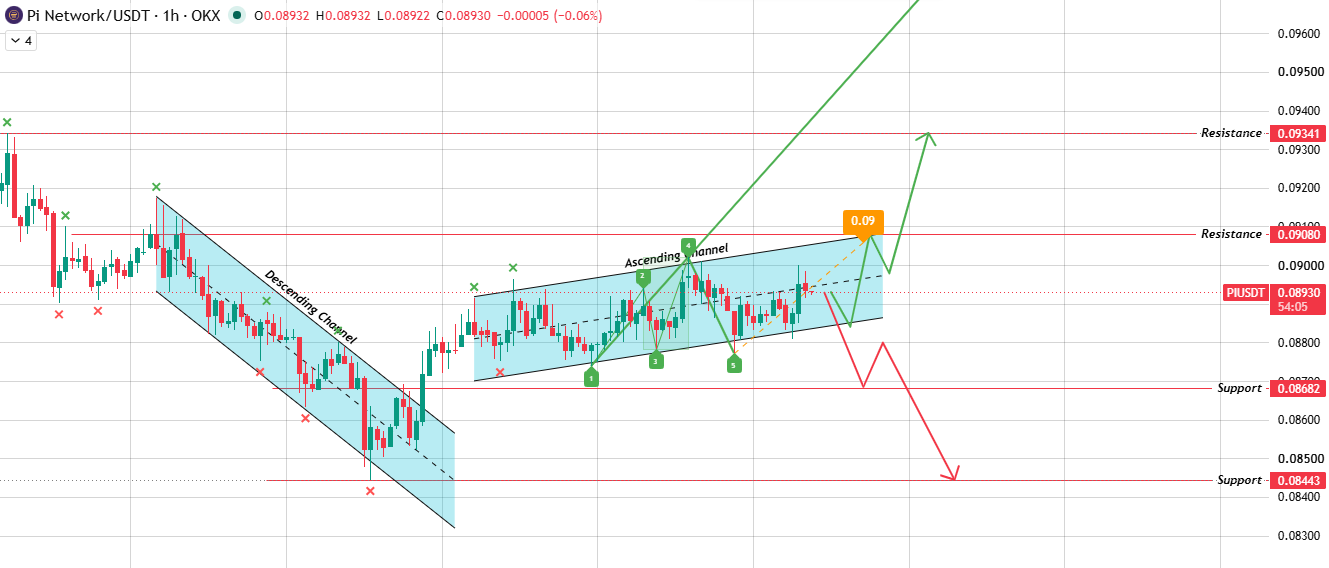
Source: Chart Taken From TradingView.
It broke out of that slide and slipped into an ascending channel instead, a series of higher lows stacking beneath a rising resistance line.
Right now the price is pressing against the top of that channel near $0.09080.
Clear that with real volume behind it, the path opens toward $0.09341.
Get rejected here instead, and a slide back to the lower boundary looks likely, with a break below it exposing $0.0868 and then $0.0844.
Worth noting: the Wolfe Wave structure on this timeframe is pointing toward that first resistance zone, which lines up neatly with where price is already knocking.
4-Hour Chart Analysis for Pi Network Price Prediction
Zooming to the 4H chart , and the picture is a descending triangle, with flat support underneath a resistance line that keeps stepping lower. 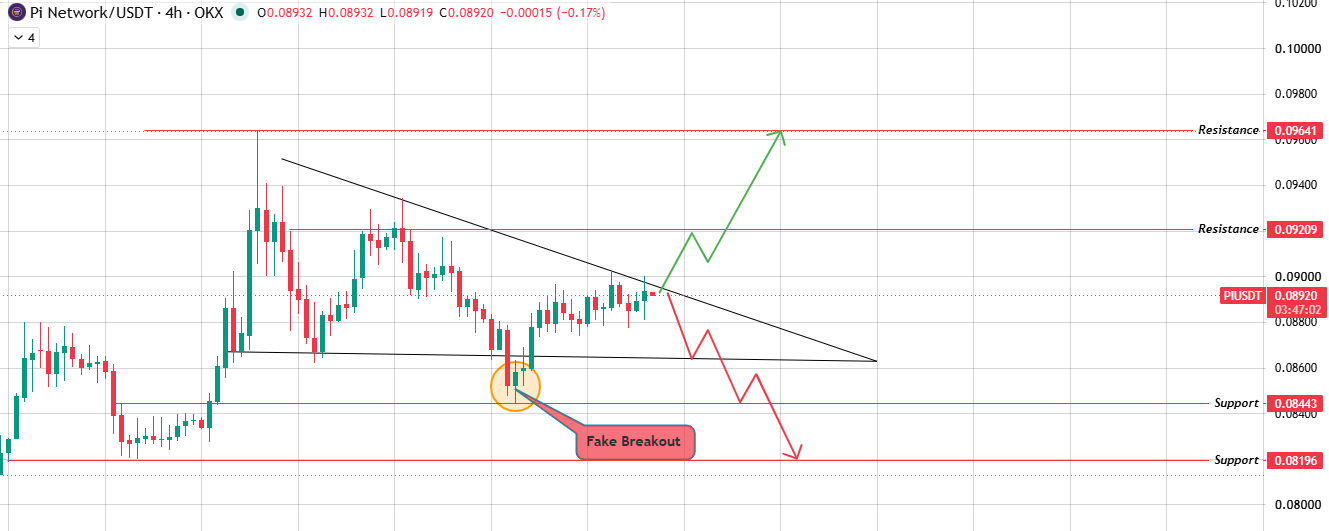
Source: Chart Taken From TradingView.
$PI is currently testing that upper trendline. A volume-backed break above it level $0.09209 first, then $0.09641 further out.
Fail here again, and the setup flips, with a drop toward $0.08443 and eventually $0.08196 on the table. There's a wrinkle though.
Price already faked out once inside this pattern, a quick liquidity sweep below support that trapped short sellers before snapping back.
That kind of move tends to leave the level a little less trustworthy the next time it's tested, so a retest of that zone deserves extra caution rather than an automatic short.
Bull, Base, Bear Case
So what does this PI Network price prediction actually lean toward? Honestly, it depends entirely on which channel boundary breaks first and how much volume shows up when it does.
Neither side has fully won the argument yet, which is exactly why both scenarios below deserve equal weight instead of picking a favorite too early.
| Scenario | Price Level | Conditions | Invalidation |
|---|---|---|---|
| Bull Case | $0.09209 – $0.0964 | Volume-backed break above 4H triangle resistance while 1H ascending channel holds | Rejection at $0.09209 and close back below 1H channel support |
| Base Case | $0.0868 – $0.09209 | Price stays contained inside both the 1H and 4H patterns | Decisive close outside either channel's boundaries |
| Bear Case | $0.0844 – $0.08196 | Break below 4H triangle support and 1H channel support | Reclaim of $0.0868 support with strong volume |
Glossary
Ascending Channel: a price structure where each low sits a little higher than the last, boxed in by two rising parallel lines.
Descending Channel: the mirror image, where price keeps stepping down between two falling parallel lines.
Descending Triangle: flat support underneath a resistance line that slopes downward, squeezing price into a shrinking range.
Resistance Level: a price zone where selling pressure has historically stepped in and stalled upward moves.
Support Zone: a price area where buyers have repeatedly stepped in to catch falling prices.
Wolfe Wave: a five-wave pattern traders use to estimate where price is likely to travel toward next.
Liquidity Sweep: a quick spike through a key level that triggers stop losses before price reverses, often called a fake breakout.
Methodology
This pi network price prediction was built from multi-timeframe chart analysis (1H and 4H) submitted for review and cross-checked against live market data, including price, volume, and supply figures. No price levels were extrapolated beyond what appeared in the source charts.
Disclaimer: This article is for informational purposes only and does not constitute financial advice. Cryptocurrency markets are highly volatile, and past chart patterns don't guarantee future outcomes. Always do your own research and consult a licensed financial advisor before making investment decisions.

















