Pi Network Price Prediction: $PI Bulls Eye $0.15 After $0.10 Breakout


Pi Network built its name on mobile mining, letting everyday users earn PI just by tapping a button daily, long before the coin ever hit an exchange.
That grassroots approach turned into one of crypto's biggest communities by the time PI finally went live for open trading.
Right now, PI trades at $0.08826, barely moved over the past day. This Pi network price prediction starts from that number.
Everything mapped out below builds off where price sits today.
Live Market Data
| Metric | Value |
|---|---|
| Current Price | $0.08826 |
| 24h Change | +0.1% |
| 24h High/Low | $0.08943 / $0.08737 |
| Market Cap | $974.63M |
| Fully Diluted Valuation | $1.499B |
| 24h Trading Volume | $4.063M |
| Circulating Supply | 11.042B PI |
| Max Supply | 100B PI |
Source: $PI market cap data taken from Coingecko, data as of Aug 13, 2026. Figures may vary slightly across other tracking websites.
Exchange & Supply Snapshot
PI's circulating supply sits at 11.042B tokens out of a massive 100B max, which explains the gap between market cap and fully diluted valuation, currently $974.63M versus $1.499B.
That's a lot of supply still to come, something worth factoring into any longer-term outlook.
Trading volume over the past day came in around $4.063M, modest compared to the market cap, suggesting price right now is being shaped more by structure than by heavy volume flow.
$PI Network News Today
Pi Network's development side has been busy. Word going around is the network just kicked off its Protocol v26 rollout, described as one of the final major upgrades before Protocol 27, which is apparently planned as the last scheduled protocol update altogether. 
Source: Data Taken From @PiNewsMedia , X Account.
The upgrade reportedly brings tighter smart contract security, better state management, stronger cross-chain functionality, and updated cryptographic infrastructure.
Sounds like Pi's core build is entering its last real development phase, which could matter for sentiment even if price hasn't reacted much yet.
Key Takeaways
-
PI's sitting at $0.08826 right now, basically flat on the day. Quiet, but not for long by the look of the charts.
-
On the 4-hour mark, the price is squeezed right up against the top of a symmetrical triangle. The decision point's close.
-
Break that upper boundary and $0.09155, then $0.09636, come into view.
-
The daily chart shows PI riding an ascending channel too. Clear the top of that and $0.10367 opens up; maybe $0.11912 further out.
-
Reject from here, though, and support drops toward $0.08447 on the 4h, all the way to $0.07034 on bigger daily weakness.
Technical Analysis for Pi Network Price Prediction
4-Hour Chart Analysis for $PI Prediction
The 4-hour chart has $PI pinned right at the top of a symmetrical triangle. This is the kind of setup that doesn't stay quiet for long. 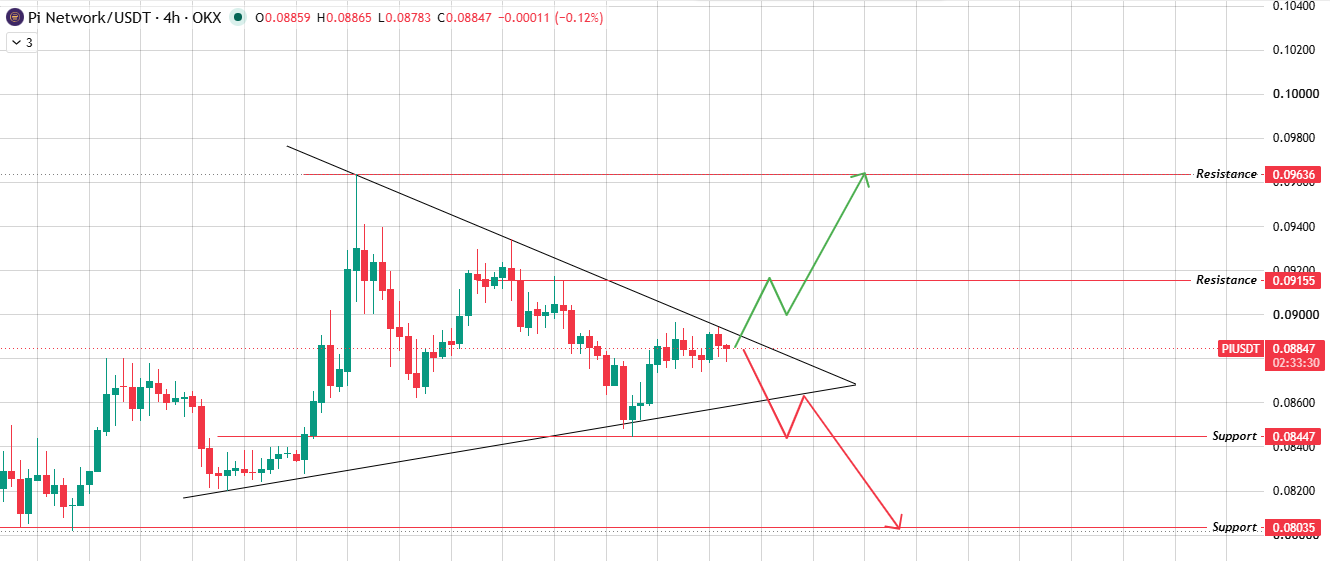
Source: Chart Taken From TradingView .
Break above it cleanly, and $0.09155 becomes the first level, with $0.09636 next in line.
But if the price gets rejected from the upper boundary then it slips back through the lower boundary, $0.08447 comes into focus first, then $0.08035 if selling picks up.
Daily Chart Analysis for $PI Prediction
The daily timeframe backs this up with its own structure. PI's been climbing inside an ascending channel since the recent bottom formed. 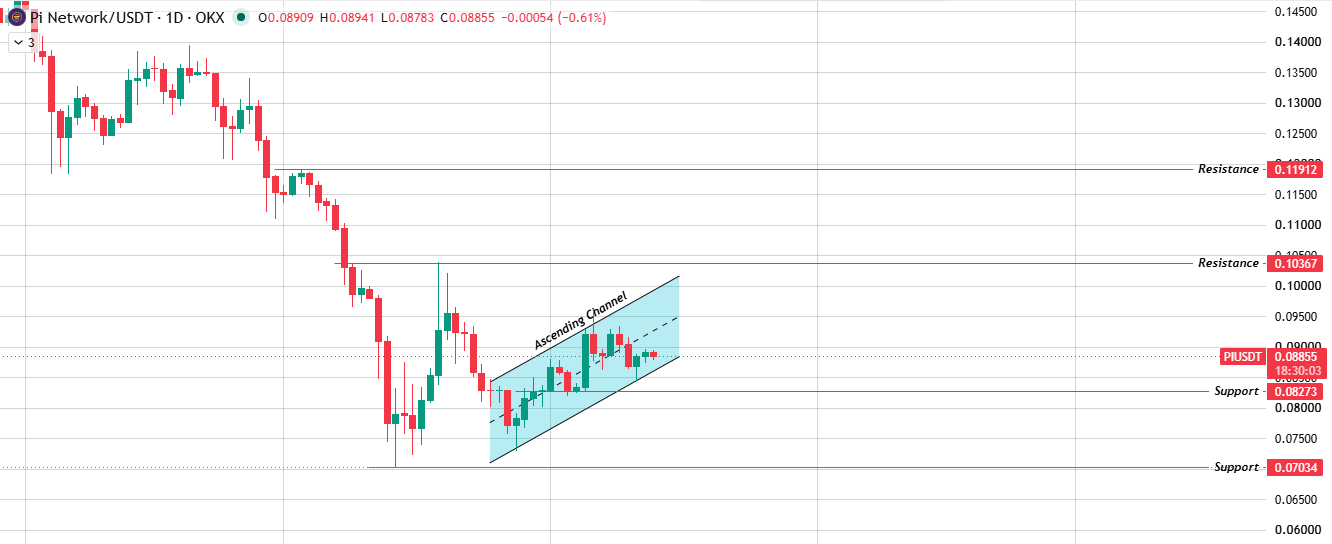
Source: Chart Taken From TradingView.
Clear the upper band of that channel, and $0.10367 is the next real resistance, stretching toward $0.11912 if momentum really carries through.
Fail there, though, and the channel's lower boundary becomes the line to watch. Break under it, and $0.08273 gives way first, with $0.07034 as the deeper floor.
Two structures, one message: PI's coiling tight, and whichever way this breaks probably won't be gradual.
Bull, Base & Bear Case
Three scenarios for where this Pi network price prediction could head next:
| Scenario | Outlook |
|---|---|
| Bull Case | Triangle and channel resistance both give way. Price pushes toward $0.09636 near-term and $0.11912 if the daily breakout holds. |
| Base Case | PI stays boxed in, chopping between $0.084 support and $0.092 resistance while the triangle plays out. |
| Bear Case | Rejection at resistance sends price back through triangle support, down toward $0.08035, with deeper risk at $0.07034. |
Glossary
A symmetrical triangle forms when converging trendlines squeeze price into a tightening range, often before a sharp move either way.
Ascending Channel describes a price climbing between two parallel, upward-sloping trendlines.
"Circulating supply" refers to coins currently available and trading in the market.
Fully diluted valuation projects what market cap would look like if the entire max supply were in circulation.
Resistance marks a level where selling pressure has historically capped price.
Support marks where buying pressure has historically held prices up.
Methodology
This pi network price prediction draws from 4h and 1d PIUSDT chart analysis on OKX, combined with live market data and recent protocol news. All levels referenced come directly from the charts provided, nothing extrapolated beyond what's visible.
Disclaimer: This article is for informational purposes only and should not be treated as financial or investment advice. Cryptocurrency markets are highly volatile, and price predictions carry no guarantee of accuracy. Always do your own research and consult a qualified financial advisor before investing.

















